
VMSI Gauge Chart — Displaying Current Sentiment and Risk Level
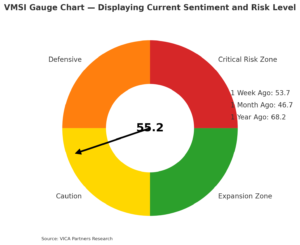 The VMSI gauge indicates a current sentiment score of 55.2, placing it in the Caution Zone. The dial’s arrow points to the yellow “Caution” sector, reflecting moderate risk appetite (neither extreme risk-off nor exuberant). The gauge’s color-coded quadrants (green for high confidence, yellow for cautious growth, orange for defensive, red for high risk aversion) show that sentiment has moved out of the defensive range. Side labels note the sentiment index one week ago (53.7, also Caution), one month ago (46.7, Defensive), and one year ago (68.2, optimistic). This context confirms that market sentiment has improved from last month’s defensive lows, but remains cautious.
VMSI Snapshot — Trend Overview
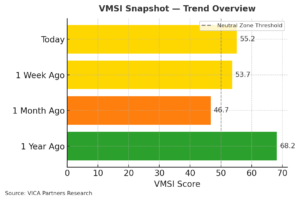 This horizontal bar chart provides a quick sentiment trend snapshot. Today’s VMSI is 55.2 (yellow bar), up from 53.7 one week ago (also yellow). One month ago the index was 46.7 (orange bar, signifying a defensive stance), and one year ago it was 68.2 (green bar, signifying much higher risk appetite). The dashed vertical line at 50 marks the neutral threshold between defensive and growth sentiment. We can see that sentiment has climbed above that neutral line recently, transitioning from the defensive zone into cautionary optimism. Compared to a year ago’s bullish sentiment, the current index is lower, reflecting more tempered expectations. However, the upward move versus last month signals improving confidence off the recent lows.
VMSI Timeline — Tracking Sentiment Shifts Over Time
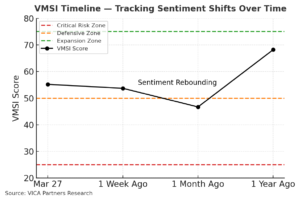 The VMSI timeline chart plots the sentiment index at four points: Mar 27 (55.2), 1 week prior (53.7), 1 month prior (46.7), and 1 year prior (68.2). The black line illustrates that sentiment dipped to a low one month ago and has since rebounded into the low-50s. Dashed lines highlight key zones: above 75 (green) is high-confidence risk-taking, below 25 (red) is extreme risk aversion, and the orange line at 50 marks the defensive/caution boundary. Notably, the index’s rise from 46.7 to 55.2 over the past month indicates sentiment rebounding out of the defensive zone. Despite this recovery, the current level remains far below last year’s exuberant 68+, underscoring that investors are still cautious.
Market Momentum — Tracking Institutional Accumulation Trends
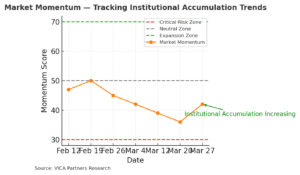 The market momentum indicator (yellow-orange line) tracks institutional buying vs. selling pressure. Over the past several weeks it fell from the high-40s into the mid-30s (indicating broad selling and risk-off positioning), then turned upward this week. The latest point (Mar 27) shows momentum climbing back to ~42 from a low of ~36, reflected by the green upward arrow. This suggests institutional accumulation is increasing again after the prior sell-off – hedge funds and other big players are selectively adding equity exposure. Dashed thresholds at 30 (red, weak momentum) and 70 (green, strong momentum) show that despite the uptick, momentum remains in a cautious middle range. Still, the reversal implies improving breadth as value-oriented stocks see renewed buying interest.
Liquidity Flows — Monitoring Capital Movement Patterns
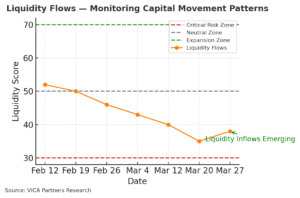 This chart monitors market liquidity and fund flows. The liquidity index (orange line) was declining steadily – from around 52 in mid-February down to the mid-30s by mid-March – indicating capital outflows, deleveraging, and defensive positioning over that period. In the latest week it ticked up slightly (green arrow), with the index rising to ~38 from ~35. This uptick denotes that liquidity outflows have eased and modest inflows are emerging. In other words, investors are starting to put cash back to work (ETF net inflows and stabilizing margin debt) after a stretch of withdrawals. The metric is still well below neutral (gray dashed line at 50), but the turn suggests risk appetite in terms of liquidity is cautiously improving.
Volatility & Risk Hedging — Monitoring Market Uncertainty
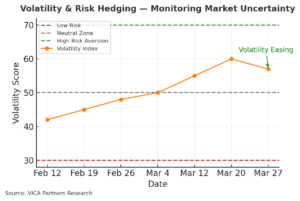 The volatility and risk hedging index (orange line) captures market uncertainty through metrics like the VIX and hedging demand. It surged from the low-40s in February up to about 60 by March 20, signifying heightened volatility and heavy hedging activity (puts buying, credit spreads widening). In the latest data it has inched down to ~57 (green arrow pointing downward), implying volatility is easing slightly from peak levels. The red dashed “Low Risk” line at 30 and green “High Risk Aversion” line at 70 show this index is still elevated in the risk-aversion zone. Thus, while the slight downtick is a positive sign, volatility remains well above calm levels – investors continue to pay up for protection as uncertainty persists (the index is still far above the neutral 50 level).
Safe Haven Demand — Tracking Treasury & Bond Inflows
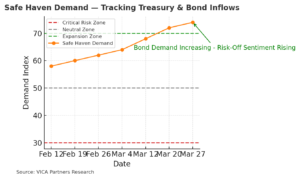 Safe-haven demand (orange line) measures the relative preference for secure assets like Treasuries. It has climbed steadily over the last several weeks – from the high-50s in mid-February to about 74 now – indicating strong and rising demand for safe havens. The green arrow underscores that bond inflows are still increasing, and risk-off sentiment remains elevated. Investors continue to seek safety, as shown by the index hovering in the upper-60s to 70+ (near the green “Expansion” risk-aversion zone). This past week, short-duration Treasuries and investment-grade bonds attracted robust inflows. The sustained high safe-haven index suggests that despite tentative re-risking in equities, many institutions are still hedging bets with defensive assets amid lingering macro uncertainties.
Defensive Sector Performance — Stability Amid Market Uncertainty
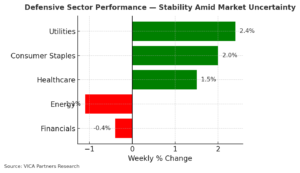 This bar chart highlights the weekly performance of defensive vs. cyclical sectors. Defensive sectors (green bars) like Utilities (+2.4%), Consumer Staples (+2.0%), and Healthcare (+1.5%) all notched solid gains over the past week, outperforming the broader market. In contrast, economically sensitive sectors lagged – Energy (-1.1%) and Financials (-0.4%) declined (red bars). This divergence signals a continued flight to safety within equities, as investors rotate into traditionally stable, dividend-paying sectors for downside protection. The strength in defensives – even as some risk appetite returns elsewhere – underscores that market participants are hedging volatility by favoring sectors that can weather uncertainty, consistent with the overall cautious sentiment reflected in the VMSI.

