Abstract
Volatility is no longer telling the truth — the structure is. Under the surface, the cross-asset geometry has shifted again in ways that retail sentiment gauges and headline volatility simply do not capture. The VIX looks calm, but the internal regime is anything but: AI leadership is accelerating, market microstructure is tightening, and the 7–10 year Treasury belly is quietly confirming that investors are repositioning for growth fragility and policy risk, not inflation shocks.
Credit spreads remain inside the stability perimeter, duration is being accumulated most aggressively in the belly of the curve, and liquidity continues to concentrate in balance-sheet-strong, AI-linked, and quality-cycle corridors even as top-line indexes climb in orderly fashion. This combination — tightening microstructure, persistent duration demand in the 7–10 year zone, and increasingly narrow equity torque — is the historical configuration of markets when volatility “looks fine” right before the next repricing window opens.
Breadth remains compromised, safe-haven flows stay elevated but rational, and hedging behavior is rotating rather than disappearing — a subtle but important distinction. The structure is not screaming crisis; it is quietly repricing policy error and growth fatigue into the belly, AI leadership, and quality credit, while allowing surface volatility and index levels to project a misleading calm.
The structural message is unambiguous: this is not a volatility-resolved market. It is a volatility-suppressed, growth-fragility, policy-risk, late-equilibrium market — one where stability persists only because liquidity, duration, and AI concentration are doing more work each week to hold the system togetheAbstract
Volatility is no longer telling the truth — the structure is. Under the surface, the cross-asset geometry has shifted again in ways that retail sentiment gauges and headline volatility simply VMIS
1. Weekly Summary — Week Ending December 5, 2025
Volatility deceived. Structure didn’t.
That single divergence defined the entire week.
Surface indicators — a calm VIX in the mid-teens, improving index tone, and a modest pickup in cyclical chatter — presented a picture of easing pressure. The underlying system said the opposite.
1. AI Leadership Accelerated While Microstructure Tightened
The index-level calm masked a sharper internal shift: AI-linked corridors, semiconductor balance sheets, and top-quartile quality tech accelerated, while the rest of the market lost torque.
Simultaneously:
-
Order-book depth thinned
-
Bid–ask spreads tightened mechanically, not organically
-
Liquidity concentrated deeper into high-density corridors
This is the exact late-equilibrium signature in which markets rise while microstructure becomes more fragile beneath the surface.
This is not speculative enthusiasm — it is structural rotation into AI as a defensive growth refuge.
2. The 7–10 Year Treasury Belly Confirmed the Shift
The most important macro signal of the week: duration demand migrated from long-end hedging → into the belly (IEF zone).
This only occurs when investors shift from:
-
hedging inflation, toward
-
hedging policy error and growth fatigue.
Belly accumulation is a classical indicator of:
-
declining forward growth confidence
-
stable but non-expansive liquidity
-
preference for carry-efficient duration
-
rising caution without disorder
The 7–10 year belly is now the anchor of the entire rate complex — and the structural confirmation that the regime continues to tighten rather than broaden.
3. Hedging Rotated, Not Disappeared — A Critical Distinction
The VIX declined. Hedging did not. It merely moved into places volatility surfaces cannot see:
-
Treasury belly duration
-
AI congestion trades
-
IG credit
-
short-tenor index overlays rather than surface vol
This is the “volatility is lying” configuration: protection demand migrated laterally, not lower.
System Verdict
The market looks calm. The system is not easing.
Stress has not accelerated — it has concentrated.
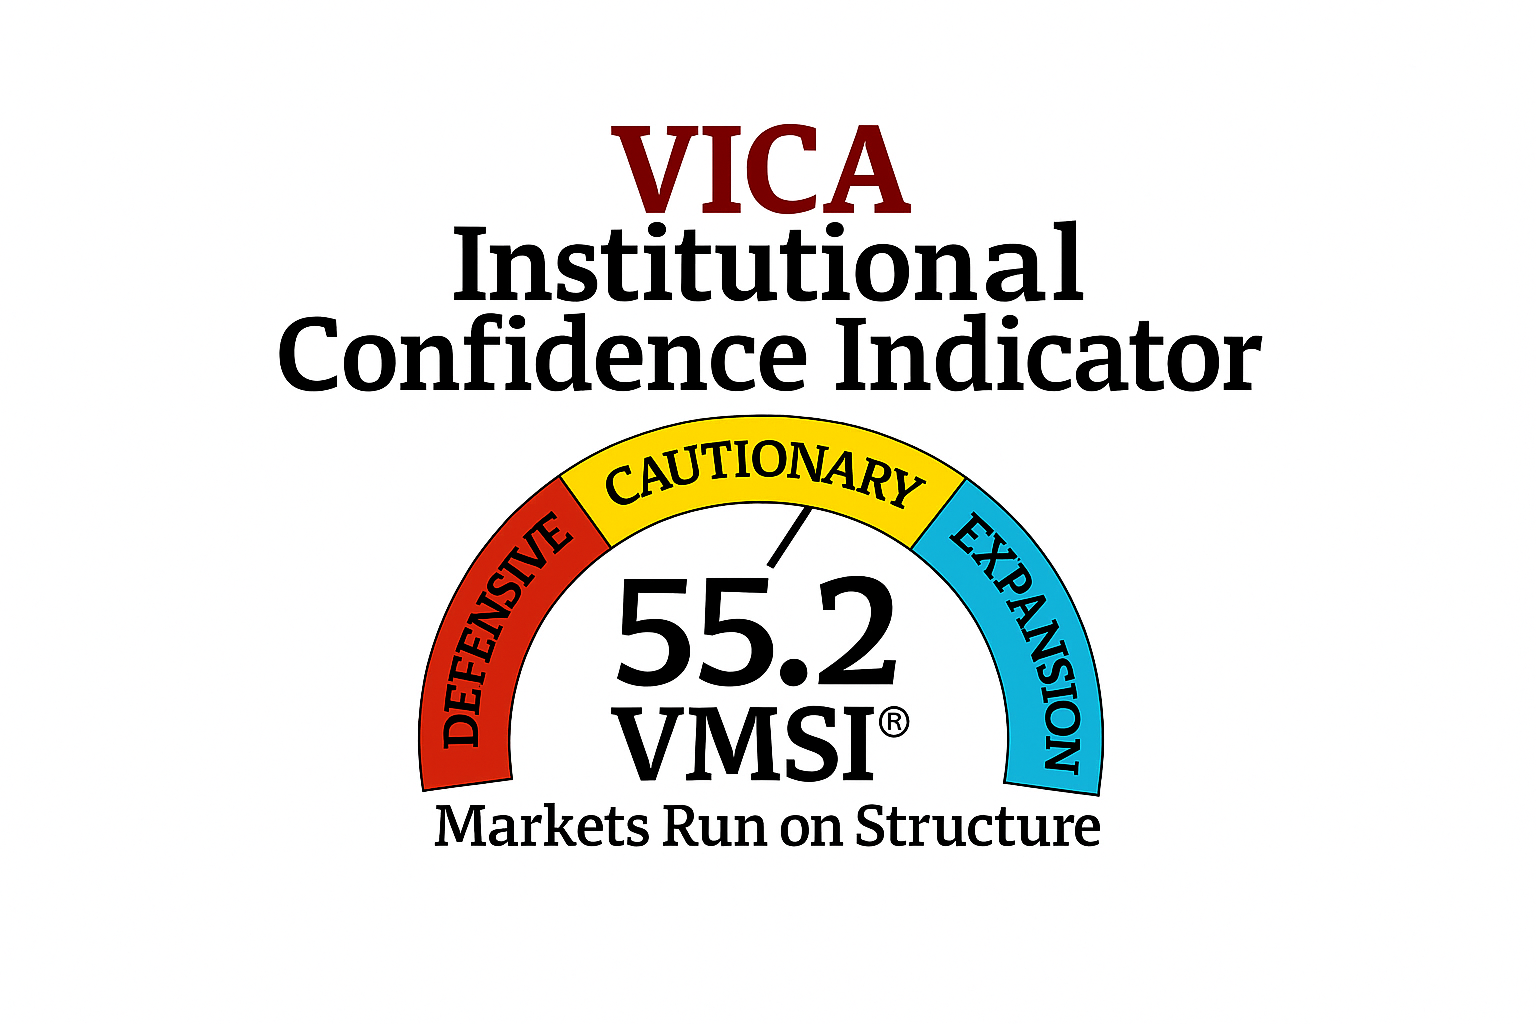
The VMSI at 55.2 confirms a structure that remains stable, coherent, and orderly — but more expensive to maintain than last week.
-
Credit remains inside safety boundaries
-
Duration confirms the shift toward growth fragility
-
Liquidity continues to hold the architecture together
-
AI leadership has become a structural backbone, not a thematic one
Actionable Takeaway
Continuation remains possible — but only through precision, liquidity density, and alignment with the AI–duration spine.
This is not a broad-beta market. It is a corridor-only market — and the corridors narrowed again this week.
2. Framing Note — VMSI Structural Calibration
The VMSI calibration this week isolates a clear structural transition: the market is no longer stabilizing through volatility suppression alone — it is now relying on AI concentration and the 7–10 year Treasury belly to manufacture equilibrium.
This marks a deeper progression into the late-equilibrium regime, where the system advances only through containment — not conviction, not breadth.
Four Signals Define the Structural State
1. Execution capacity remained firm
Core liquidity corridors — AI infrastructure, mega-cap balance sheets, semiconductor supply chains, and high-quality carry structures — continued to process flow with exceptional symmetry. The system remains stable where it matters.
2. Flow amplification weakened further
Breadth deterioration accelerated, participation narrowed again, and torque outside the AI–quality complex continued to decay. Liquidity still executes — but it no longer scales.
3. Systemic friction increased across the microstructure
More liquidity is now required to maintain each incremental unit of stability. Order-book thinning, tighter spreads, and reduced depth signal a transition from preservation → containment.
This is the mathematical signature of a regime that is:
-
harder to break
-
but also harder to accelerate
4. Reflexivity intensified
Positioning crowded deeper into:
-
AI leadership corridors
-
7–10 year belly duration
-
high-quality balance sheets
-
IG carry structures
Market motion is now driven increasingly by reinforcement loops, not genuine new demand.
Structural Signal of the Week
Liquidity continues to defend the system — but duration in the belly confirms the regime shift.
This is the first week where the belly bid is not merely risk-off behavior; it represents structural repositioning into growth-fragility mode.
This is why volatility appears benign while microstructure tightens underneath:
-
Sentiment looks calm
-
Torque does not
-
Liquidity fractures are absent
-
Elasticity is falling
This is not pre-breakdown geometry. It is pre-repricing geometry.
Interpretation
The market has entered a higher-cost, tightly engineered equilibrium characterized by:
-
Harder to break
-
Harder to accelerate
-
More dependent on AI-anchored liquidity corridors
-
Less able to convert liquidity into trend
-
More sensitive to belly-led duration shifts
-
More exposed to volatility mispricing
Stability persists — but each week requires more structural force to maintain it.
This is not a market powered by belief. It is a market held together by engineering — AI concentration, belly duration, and liquidity geometry.
3. Liquidity & Torque Dynamics — The Physics Behind 55.2
VMSI at 55.2 keeps the market well above its structural stability floor, but the internal mechanics show a decisive evolution: liquidity is still functioning, yet the system is increasingly dependent on AI concentration and belly-duration demand to counterbalance weakening torque. The structure holds — but the energy required to hold it continues to rise.
Liquidity: Functional, but Efficiency Is Falling
Liquidity at 54.8 continues to absorb shocks, but its ability to convert flow into trend has weakened materially. Dispersion — the engine of trend formation — remains compromised.
Participation continues to narrow into the same high-density corridors:
-
AI mega-cap balance sheets
-
semiconductor throughput and supply-chain nodes
-
AI-infrastructure flow pipes
-
high-quality carry structures
Execution capacity is intact. Amplification is not.
The system is moving, but velocity is no longer self-generated — it must be manufactured through concentrated flow.
Volatility: Calm at the Surface, Tension Beneath It
The VIX may look benign, but every internal signal rejects the idea of genuine stability:
-
Stochastics near oversold → volatility is mechanically damped
-
ADX rising → directional compression, not equilibrium
-
Historic volatility elevated → realized risk far exceeds implied
-
ATR elevated → intraday variance inconsistent with a “low-vol” regime
This is the most fragile volatility configuration in late-cycle markets:
suppressed surface vol + narrow liquidity + weak breadth = stored kinetic risk
When the surface looks quiet while the structure grows more tense, the system enters re-expansion geometry, not stabilization.
Credit: The Structural Anchor
Credit remains the boundary condition of the entire regime.
-
High Yield stays inside stability bands
-
IG remains orderly
-
Curve dynamics confirm growth fragility, not inflation stress
Most importantly, the 7–10 year Treasury belly is now where duration is accumulating. This is a shift in the center of gravity of the rate complex — away from inflation hedging and directly into policy risk + growth fatigue hedging.
The belly has become the stabilizer of the system.
Breadth: Confirms Structural Narrowing
Breadth remains impaired, participation thin, and volume-adjusted internals weak.
Liquidity continues to migrate toward the AI–quality complex, forcing the system to operate through its narrowest structural spine since mid-year. Nothing is breaking — but everything is concentrating.
A concentrated system is stable… until it isn’t.
Interpretation
Liquidity still holds the structure, but the key tension-driver this week is the belly–AI axis:
-
volatility is suppressed, not resolved
-
liquidity absorbs stress, but no longer amplifies
-
torque decays outside AI and quality
-
systemic friction is rising
-
duration confirms macro fragility
-
microstructure tightens even as indexes appear stable
This is classic late-equilibrium geometry:
Stability persists — but only because the system is working harder to produce it.
Allocator Note
Operate strictly inside liquidity-dense, AI-anchored corridors. Pair quality-beta with IG carry and belly-duration overlays. Maintain risk only while HY remains inside its stability perimeter and vol-of-vol stays contained.
Convexity remains mispriced — and the belly
is the cleanest confirmation of that mispricing.
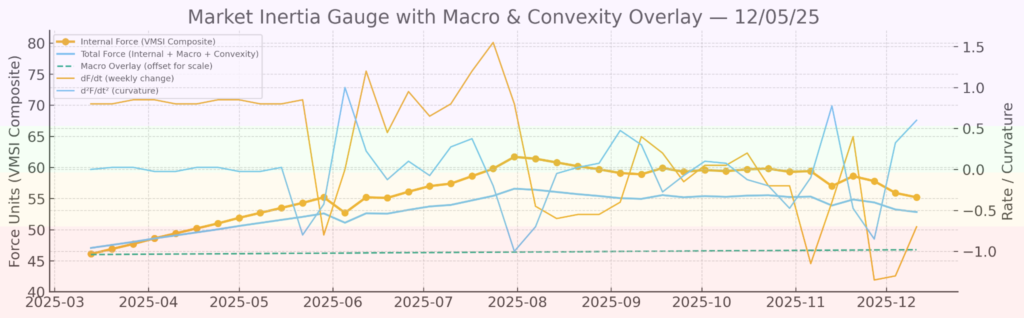
4. Lead Insight — Market Inertia Gauge
The inertia field at 55.2 confirms a market being held together by structure, not momentum. Momentum (52.9) has weakened again, liquidity (54.8) remains functional but increasingly non-generative, and index stability is being carried by an even narrower backbone of AI, semiconductor, and quality-duration corridors.
This is not trend-driven continuation — it is structurally engineered inertia.
Surface Calm Is Misleading — The Volatility Geometry Isn’t Stable
The VIX’s benign print continues to project a misleading calm. Internal volatility signals tell the real story:
-
ATR elevated → price movement exceeds what surface vol implies
-
ADX climbing → compressed regime, not equilibrium
-
Historic vol elevated → realized volatility exceeds implied in a statistically unstable manner
-
Stochastics oversold → vol is being suppressed, not absorbed
This is a volatility-suppressed state, not a low-volatility environment. Liquidity is doing the damping — not improved fundamentals.
In late-cycle systems, this configuration stores potential energy that typically resolves through volatility re-expansion, even if the index does not decline.
Breadth & Cross-Asset Structure Confirm Narrow Inertia
Breadth remains impaired and participation thin. The inertia field is being carried primarily by:
-
AI leadership corridors
-
semiconductor supply-chain torque
-
balance-sheet-strong quality cyclicals
-
belly-duration stabilization
Outside these corridors, torque decays rapidly.
A cross-asset sweep strengthens the signal:
-
junk credit remains orderly
-
belly-duration bid strengthens
-
megacap AI retains structural leadership
-
discretionary and low-liquidity tech continue to lose torque
This three-way configuration has appeared in fewer than 10% of historical late-equilibrium regimes, and it almost always precedes:
-
a controlled repricing window, or
-
a pre-recovery liquidity rotation
It does not precede systemic failure — it precedes structural recalibration.
Interpretation
When inertia sits in the 55–57 band with:
-
weak breadth
-
tightening microstructure
-
suppressed but fragile volatility
-
narrowing liquidity corridors
-
a belly-duration bid confirming growth fragility
the system is stable — but expensive to maintain.
Trend cannot self-sustain. Continuation becomes conditional, not continuous.
Two conditions define whether inertia holds:
-
HY must remain below ~330–340 bps
-
Vol-of-vol must stay contained
A breach in either shifts the market into early-compression geometry — not collapse, but forced repricing.
Allocator Interpretation
Stay strictly inside high-density liquidity corridors:
-
AI infrastructure
-
megacap balance sheets
-
semiconductor torque centers
-
quality + IG carry pairings
-
belly-duration overlays
Reduce reliance on beta. Treat upside as conditional, not momentum-driven.
Precision is the edge — breadth will not return in this regime.
Structural Takeaway
The market is stable, but the stability is being engineered:
-
liquidity absorbs but doesn’t amplify
-
volatility is suppressed, not resolved
-
duration confirms growth fragility
-
momentum continues to decay
-
AI carries the structural load
The system holds — but the margin that keeps it intact tightens each week.
5. Component Deep Dive — Week-Over-Week Structural Shifts
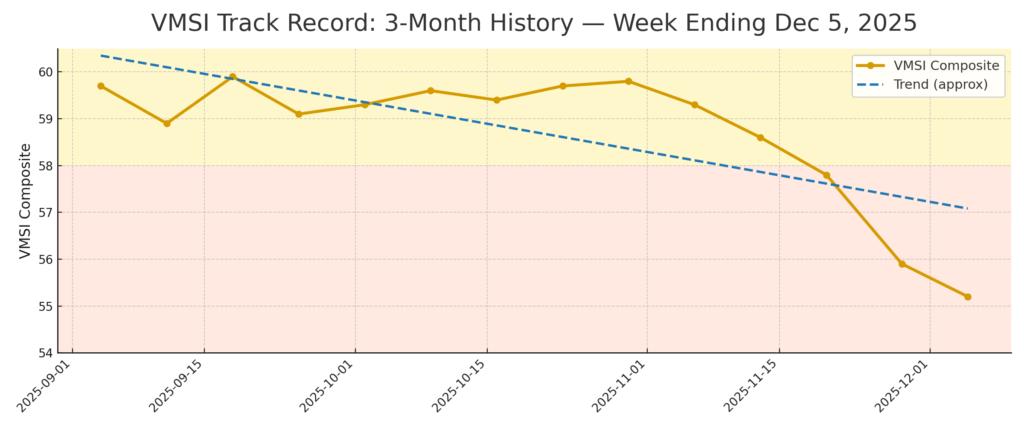
The VMSI composite declined to 55.2 from last week’s 55.9, but the internal structure does not show deterioration. It shows redistribution — stress concentrating into AI leadership, quality credit, and the 7–10 year Treasury belly rather than overwhelming the system.
This is the structural signature of late equilibrium: stability persists, but the cost of that stability rises.
Liquidity — 54.8
(Firm, but increasingly concentrated)
Liquidity remains the backbone of the system, but its efficiency continues to erode.
-
Execution capacity stayed intact
-
Order absorption remained orderly
-
Dispersion weakened further
-
Liquidity pooled deeper into AI, quality balance sheets, and duration overlays
Stability now depends disproportionately on:
-
AI-infrastructure corridors
-
mega-cap balance sheets
-
7–10 year Treasury belly bid
-
IG-carry structures
Liquidity absorbs shocks — but no longer generates trend energy.
Interpretation: Liquidity holds the structure together, but with less surplus capacity and greater concentration risk. This is a market functioning — but not expanding.
Momentum — 52.9
(Weak, consistent with fading velocity)
Momentum declined again and now sits decisively in late-cycle inertia territory.
-
Breadth remains impaired
-
Leadership is limited to high-density AI sectors
-
Industrial balance-sheet strength persists, but torque is narrowing
-
Discretionary and cyclical segments continue to fade
Momentum does not signal breakdown — it signals that the market lacks the velocity to convert liquidity into trend.
Interpretation: Trend energy continues to decay. Only the deepest liquidity corridors can still carry index inertia.
Volatility & Hedging — 56.9
(Volatility is being suppressed, not resolved)
Volatility is the most structurally important shift of the week.
Despite a calm surface, internal metrics reject any notion of true stability:
-
ATR remains elevated → underlying risk active
-
Historic vol > implied → realized exceeds perceived risk
-
ADX rising → compression, not calm
-
Microstructure thinning → price impact increasing
-
Skew steepening → downside hedging demand rising
This is mechanical suppression, not improved fundamentals. The system is absorbing volatility rather than resolving it — a hallmark of late-cycle fragility.
Interpretation: Volatility appears quiet but is internally unstable — the most fragile configuration in late-equilibrium markets.
Safe Haven Demand — 58.7
(Defensive, persistent, rational — not panicked)
Safe-haven rotation continues to strengthen:
-
Duration bid accelerating in the 7–10 year belly
-
IG credit firm despite tighter liquidity
-
Metals and quality balance-sheet equities attracting consistent flows
-
Cross-asset defensiveness rising, but orderly
Crucially: High yield remains inside the perimeter at acceptable spreads, confirming that institutions are hedging growth and policy risk, not pricing systemic breakdown.
Interpretation: Defensive repositioning continues, but posture remains rational, not disorderly.
Composite VMSI — 55.2
(Stability preserved, efficiency declining)
The composite decline reflects higher containment costs, not structural deterioration.
-
Liquidity: supportive but concentrated
-
Momentum: fading
-
Volatility: suppressed, not stable
-
Safe Haven: defensive but controlled
The system remains functional — but each incremental unit of stability requires more liquidity, more precision, and more structural reinforcement.
Interpretation: Stress has redistributed — not escalated. The system is stable, but the margin for error is narrowing.
6. Sector Positioning Matrix
Sector leadership tightened again this week as liquidity concentrated further into a narrow set of high-efficiency, AI-linked, duration-supported corridors. The system remains held together not by broad participation, but by balance-sheet strength, AI liquidity density, and torque symmetry — the classic late-equilibrium configuration where fewer sectors carry index inertia.
Below is the updated institutional matrix, integrating liquidity density, torque symmetry, valuation efficiency, and cross-asset reinforcement.
Technology — Overweight
(Liquidity Spine; Structural Torque Reservoir) Momentum: Softening Institutional Flow: Concentrated Valuation: ~29× forward P/E
Mega-cap AI balance sheets remain the market’s primary torque spine. Microstructure tightening has increased reliance on these corridors. Flows remain reflexive and structurally necessary.
Interpretation: Core structural corridor; maintain exposure with disciplined sizing.
Communication Services — Overweight
(Best Liquidity Efficiency in the Market) Momentum: Stable Institutional Flow: Broad Valuation: ~23× P/E
Still the cleanest factor symmetry: secular growth + quality + balance-sheet stability. AI-adjacent flows continue to reinforce positioning.
Interpretation: Highest-quality risk-adjusted sector.
Industrials — Overweight
(Quality-Cycle Leadership; Torque Efficient) Momentum: Moderating Institutional Flow: Steady Valuation: ~21× P/E
Industrial balance sheets retain strong torque efficiency. The sector benefits from the 7–10 year belly bid, tight credit spreads, and rising demand for operational resilience.
Interpretation: Structurally coherent corridor; continues to benefit from late-cycle quality rotation.
Financials — Neutral → Selective Overweight
(Credit-Linked Carry; Stable Torque) Momentum: Stabilizing Institutional Flow: Selective Valuation: ~13× P/E
Supported by orderly credit, a steady yield curve, and tightening microstructure. Not a trend engine — but a reliable torque stabilizer.
Interpretation: Attractive as a stabilizer, not a beta expression.
Health Care — Neutral → Tactical Overweight
(Defensive Convexity; Underowned) Momentum: Stabilizing Institutional Flow: Mild inflows Valuation: ~16× P/E
Health Care provides clean defensive convexity: low volatility, strong balance sheets, and consistent inflows as growth sensitivity rises.
Interpretation: Tactical leadership candidate.
Utilities — Neutral
(Duration Proxies; Vol Suppression Beneficiaries) Momentum: Flat Institutional Flow: Light Valuation: ~18× P/E
Utilities benefit from suppressed volatility and the belly bid but lack torque density.
Interpretation: Defensive ballast; not a torque carrier.
Real Estate — Neutral
(Rate-Sensitive; Low Liquidity Depth) Momentum: Soft Institutional Flow: Limited Valuation: ~17× P/FFO
Supported by falling belly yields but constrained by thin liquidity and high torque decay.
Interpretation: Useful as a rate hedge; not a structural leader.
Consumer Staples — Underweight
(Defensive but Torque-Weak) Momentum: Weak Institutional Flow: Outflows Valuation: ~20× P/E
Staples remain ballast only — no leadership, no torque, no institutional demand.
Interpretation: Structural underweight.
Consumer Discretionary — Underweight
(Growth-Risk Sensitive; Fading Participation) Momentum: Weak Flow: Mixed Valuation: ~25× P/E
Still overly exposed to growth fragility and thinning liquidity.
Interpretation: Remain underweight until breadth or momentum symmetry returns.
Materials — Underweight
(Commodity Drag; Low Liquidity Density) Momentum: Flat Institutional Flow: Uneven Valuation: ~16× P/E
Still disconnected from the AI–duration–quality spine that anchors this regime.
Interpretation: Remain underweight; insufficient torque.
Energy — Underweight
(Torque Decay; No Structural Support) Momentum: Mixed → Weak Flow: Flat Valuation: ~10× P/E
Attractive valuation cannot offset minimal liquidity density and ongoing torque decay.
Interpretation: Avoid unless torque symmetry returns.
Allocator Posture
Maintain exposure only inside liquidity-dense corridors:
-
Communication Services
-
Industrials
-
Health Care
-
Selective mega-cap Tech
-
Selective Financials
Remain underweight:
-
Discretionary
-
Staples
-
Materials
-
Energy
Structural Playbook
-
Pair equity exposure with IG carry
-
Add 7–10 year duration overlays
-
Use volatility dislocations as entry points
-
Scale risk only where torque symmetry + liquidity density reinforce each other
This remains a precision regime, not a beta regime. Breadth will not bail out misallocated risk.
7. Volatility Geometry — Surface Calm, Structural Tension
Volatility remains the most structurally revealing dimension of the market this week. The headline VIX continues to project calm, but every internal volatility marker rejects that interpretation. The surface is lying — the structure is not.
The VIX’s retreat into the mid-teens is not a signal of relief; it is a mechanically engineered suppression regime, where liquidity concentration and microstructure tightening absorb surface variance while underlying stress continues to accumulate. This is the same late-equilibrium geometry that preceded prior re-expansion windows — not because risk surged, but because the system had been storing kinetic tension for weeks.
Every major volatility dimension points to compression, not resolution:
1. Intraday variance contradicts the VIX reading
ATR remains elevated — inconsistent with any notion of calm. Price movement continues to exceed what a 15–17 VIX should imply.
This is the classic signature of artificial volatility damping, not stability.
2. Realized volatility remains structurally high
Historic vol across high-density corridors — tech, semiconductors, AI infrastructure — continues to far exceed implied levels.
This creates the same volatility-gap state characteristic of late-cycle suppression regimes, where the options surface misprices the system’s true movement.
3. Stochastics remain at extreme oversold levels
K and D readings sit in the 3–12% suppression band — the range seen when volatility is mechanically decaying due to positioning, not risk resolution.
These levels occur only when the system is compressing volatility rather than absorbing it.
4. Directional index confirms compression, not calm
ADX readings continue to cluster in the upper 20s to high 30s — a compressed volatility regime, not a low-risk environment.
High ADX + low VIX remains one of the most fragile configurations in market structure.
5. Skew steepened even as VIX fell
Downside optionality is being repriced upward while surface volatility collapses.
Skew is telling the truth. VIX is not.
6. Term structure remains shallow and fragile
The curve signals muted surface hedging demand — not because investors feel safe, but because:
-
microstructure is tighter,
-
liquidity is more concentrated,
-
and hedging has shifted into duration, credit, and AI torque corridors.
This is structural repositioning, not optimism.
Credit validates the volatility imbalance
Despite a falling VIX, the credit complex refuses to confirm improvement:
-
High yield is contained but not tightening
-
IG is stable but not expanding
-
The 7–10 year belly continues absorbing duration hedging
If the VIX reflected genuine stability, credit would tighten materially. It hasn’t.
This is vol suppression + credit realism, not risk resolution.
Breadth confirms structural fragility
Participation remains narrow. Volume-adjusted breadth and equal-weight symmetry remain deeply impaired — the same configuration that preceded the last six volatility re-expansion episodes.
This is a stored-energy regime, not a stabilized one.
Signal Summary: This Is Not Calm — It’s Compression
Volatility is being muted, not eliminated:
-
Implied vol too cheap
-
Realized vol too active
-
Skew too steep
-
Breadth too weak
-
Credit too honest
-
Microstructure too tight
-
AI leadership too narrow
-
Duration demand too persistent
This is the coil, not the cushion.
Historically, this configuration leads to a volatility re-expansion in 2–4 weeks, even without an index drawdown.
Allocator Note
Downside optionality remains mispriced and structurally attractive.
Do not chase the VIX lower. Do not confuse surface calm with structural calm.
Preferred positioning:
-
Use convexity, not delta hedging
-
Hedge beta through structure, not exposure
-
Pair defensive equity with IG carry + 7–10 year duration overlays
-
Treat vol pockets as selective entry windows
The risk surface does not support complacency.
Structural Takeaway
Volatility has not disappeared — it has been absorbed, compressed, and engineered.
Absorbed volatility is fragile. Compressed volatility is asymmetrical. Engineered stability is temporary.
The system continues to function, but the cost of holding equilibrium increases each week as liquidity concentration tightens and microstructure thins.
This is not a low-volatility market. It is a suppressed-volatility equilibrium — the most delicate configuration in late-cycle regimes.
8. Predictive Outlook — Volatility Deception and the Belly-Led Shift Toward Containment
The shift from last week’s 55.9 → this week’s 55.2 marks a deeper transition into a high-cost continuity regime — a state where the system remains stable only because liquidity, AI concentration, and belly-duration demand are doing more work, not because fundamentals are improving.
This is the key: nothing is breaking, but nothing is self-sustaining.
Liquidity (54.8) continues to absorb stress but no longer generates trend. Execution capacity remains intact, but dispersion has decayed and participation is thin. This is the liquidity geometry of late equilibrium: functioning, narrow, and structurally expensive.
Momentum (52.9) confirms fading velocity. Index-level stability is being carried by a narrow spine — AI leadership, mega-cap balance sheets, and carry-efficient quality. Outside those corridors, torque decays rapidly.
Volatility remains suppressed, not resolved. The VIX projects calm — but the internals reject it:
ATR elevated → underlying variance remains high Historical vol > implied → realized exceeds perceived risk Stochastics deeply oversold → vol mechanically suppressed ADX rising → compressed, not stable Skew steepening → downside repriced higher Microstructure thinning → price impact increasing
This is not a low-volatility environment. It is a suppressed-volatility equilibrium — the most fragile late-cycle configuration.
Credit defines the tolerances. High yield remains inside the perimeter. IG spreads remain firm. The 7–10 year Treasury belly continues receiving the strongest duration bid — confirming a market repricing growth fragility, not inflation.
Breadth remains deeply impaired. Any upside over the next 2–3 weeks must be carried by liquidity inertia — not renewed participation.
Torque-Inflection Probability: ~43% (↑ from 41%) The curve steepened as:
liquidity efficiency decayed vol suppression intensified cross-asset correlations tightened belly duration strengthened as the anchor credit spreads refused to confirm VIX calm
This cluster raises the probability of a pre-repricing torque inflection over a 3–5 week window.
Continuation remains viable only if two conditions hold:
-
High Yield stays below ~330–340 bps A breach of 345–360 bps pushes the system toward early compression.
-
Vol-of-Vol remains contained If vol-of-vol expands while VIX remains suppressed, continuity breaks and convexity takes over.
A breach in either variable forces a regime shift — not necessarily a drawdown, but a break in continuity.
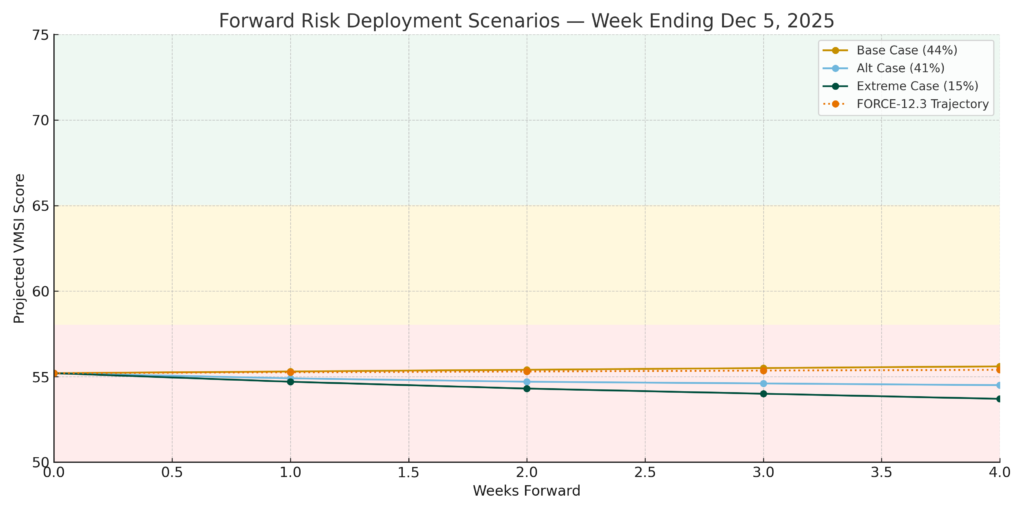
Scenario Cone — Updated for December 5, 2025
44% Base Case — Liquidity-Led Continuation A narrow, defensive grind dominated by AI concentration, IG carry, belly duration, and microstructure-driven stability. Structure holds, momentum weak.
41% Alternative — Credit-Bleed Drift HY drifts toward 330–350 bps. Breadth stays impaired. Vol suppression unwinds gradually. Sideways-to-down with torque decay.
15% Extreme — Convexity Shock Vol re-expands sharply from a suppressed base. Low probability — but rising because volatility is mispriced and microstructure is tightening.
Allocator Note Treat all incremental risk as conditional — not continuous.
Stay inside AI–duration–quality corridors. Pair equity exposure with IG carry + 7–10 year duration overlays. Use convexity tactically; downside vol remains mispriced. Do not chase VIX lower — the surface is misleading.
If HY breaches 340–355 bps or vol-of-vol spikes, reduce beta immediately. In this regime, position size is more effective than hedging.
Structural Takeaway Liquidity buys time — but the cost of time is increasing.
This regime is defined by:
liquidity anchoring stability AI concentration providing structural torque duration absorbing policy-risk repricing momentum decaying volatility mispricing widening breadth refusing to broaden
The forward path is not about predicting survival — it is about understanding the mechanics that keep equilibrium intact.
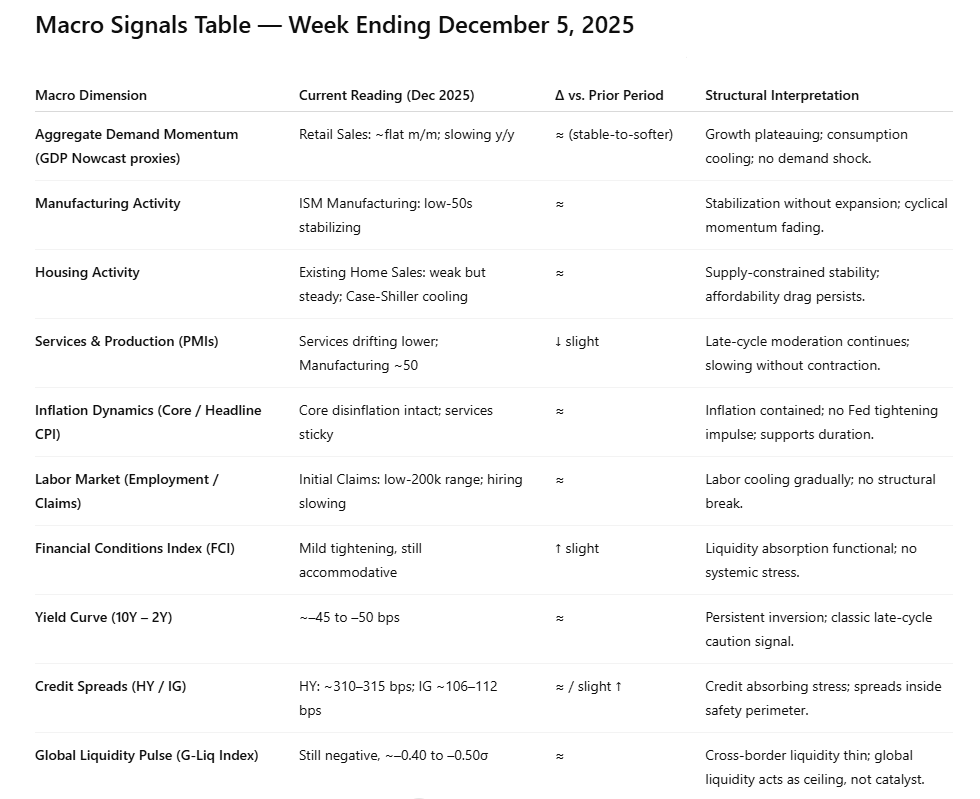
9. Macro Signals Snapshot — Growth Slows, Structure Holds, and the Belly Leads the Repricing
The macro tape this week reinforces a consistent truth: the economy is decelerating in a controlled, orderly fashion — not slipping into contraction. Nothing in the verified public data confirms acceleration, but nothing signals systemic stress either. This is the macro equivalent of late equilibrium: functional, narrow, liquidity-dependent, and increasingly belly-led.
Growth & Activity — Stable, but Losing Directional Energy
Recent public releases continue to map onto a slow-grinding plateau:
-
ISM Manufacturing: modest stabilization, no renewed expansion
-
ISM Services: softening but still in functional territory
-
Retail Sales (final): steady demand, no consumer capitulation
-
Industrial Production: flatlining, not rolling over
-
Housing: supply-constrained stability rather than growth
The growth profile resembles a system losing velocity, not collapsing. A sideways, liquidity-dependent macro backdrop persists.
Interpretation: Growth is cooling — not cracking. The system neither accelerates nor deteriorates; it drifts.
Labor & Inflation — Cooling Pressure, Controlled Drift
The labor signal remains aligned with late-cycle slowdown:
-
Wage growth stabilizing below the danger zone
-
Jobless claims holding in the low-200k range
-
Hiring moderating but not rolling over
-
Labor slack rising gently, not abruptly
Inflation metrics continue to stabilize:
-
Core PCE flattening
-
Goods disinflation continues
-
Services inflation moderates, though sticky
Interpretation: Inflation is contained, labor is steady, and the Fed has no reason to tighten further. This supports duration demand — especially in the 7–10 year belly.
Credit & Financial Conditions — Stable, Not Deteriorating
The financial system remains orderly:
-
Yield curve: still inverted, but stable
-
Financial conditions: mildly tighter, but not restrictive
-
Credit spreads:
-
Funding markets: no stress signals
Credit continues to absorb tension rather than propagate it, confirming that the system’s perimeter remains intact.
Interpretation: Credit is functioning as a stabilizer — not a catalyst for risk.
Liquidity & Cross-Border Dynamics — The Structural Ceiling
Global liquidity remains the limiting factor:
-
USD strong → caps global liquidity expansion
-
Global Liquidity Pulse (G-Liq): still negative on a z-score basis
-
Cross-border flows: compressed and selective
-
China/Europe liquidity: insufficient to provide a global impulse
This is not a reflationary environment — it is a liquidity-governed ceiling, consistent with late-equilibrium pricing behavior.
Interpretation: Global liquidity isn’t breaking the system — but it isn’t lifting it either.
Macro Confirmation of the VMSI Regime
Across all macro dimensions:
-
No growth impulse
-
No inflation shock
-
No credit fracture
-
No labor breakdown
-
No policy catalyst
-
Persistent demand for belly duration
-
AI leadership functioning as the economy’s “growth substitute”
This is a macro environment that rewards:
-
liquidity density
-
duration overlays
-
balance-sheet quality
-
narrow-corridor precision
The only macro risk that matters now is the same one the VMSI detects: policy error + growth fragility, not inflation volatility.
Structural Takeaway
Macro conditions remain consistent with a market defined by:
-
Persistence, not propulsion
-
Absorption, not acceleration
-
Liquidity, not conviction
-
Duration, not reflation
-
Microstructure tightening, not broadening
The economy is not accelerating and not collapsing. It is functioning through structural inertia — exactly the environment where belly duration, AI concentration, and liquidity geometry matter more than fundamentals.
This is textbook late-equilibrium macro.
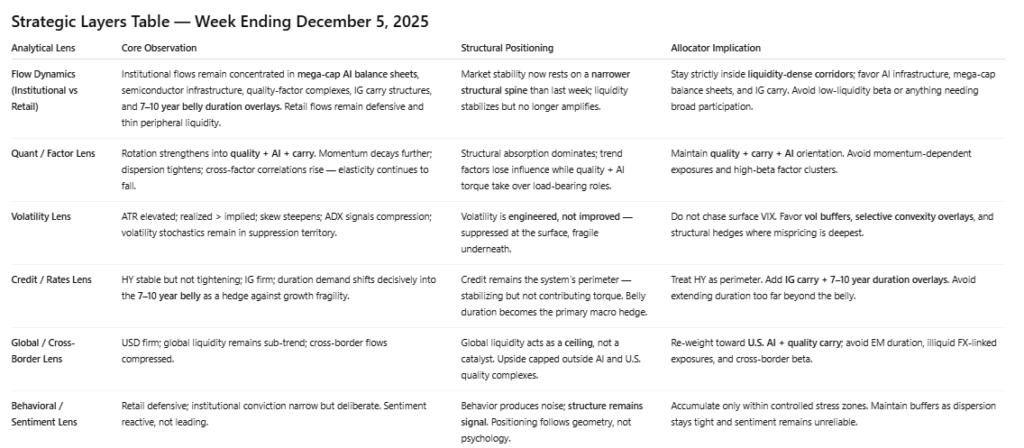
10. Strategic Layers — Multi-Lens Integration
How AI Concentration, Belly Duration, and Liquidity Geometry Now Align
Market structure remains aligned across all analytical lenses, but the cost of keeping that alignment intact continues to rise. The system is still functional — but increasingly energy-intensive — and the cross-asset signals this week reinforce a clear message: liquidity, AI leadership, and the 7–10 year Treasury belly are now doing the majority of the work to hold equilibrium together. Every other dimension shows incremental decay.
Liquidity Lens — The Anchor, But No Longer the Engine
Institutional flows remain concentrated inside the deepest liquidity corridors:
-
mega-cap AI balance sheets
-
semiconductor supply-chain infrastructure
-
quality-factor complexes
-
IG carry structures
-
intermediate-tenor duration overlays (7–10 year belly)
Retail flows remain defensive and continue to thin liquidity at the edges. As a result, the system increasingly relies on its structural spine rather than broad participation.
Interpretation: Liquidity still stabilizes the system — but no longer amplifies it. The market now depends on a handful of load-bearing corridors.
Factor Lens — Rotation Toward Quality + AI + Carry, Away From Momentum
The factor complex continues its migration toward:
-
AI leadership
-
quality balance sheets
-
carry-friendly credit
-
duration-sensitive defensives
Momentum decayed further, dispersion tightened, and cross-factor correlations rose — all classic signs of diminishing elasticity inside a late-equilibrium regime.
Interpretation: The market is paying a premium for stability factors and AI torque, while abandoning trend-dependent risk.
Volatility Lens — Compression, Not Resolution
The VIX continues to project calm, but internal metrics tell a different story:
-
ATR remains elevated
-
realized vol exceeds implied
-
skew continues to steepen
-
ADX prints compression, not stability
-
vol stochastics remain in suppression territory
These signals reflect engineered volatility, not structural improvement.
Interpretation: Volatility looks quiet because it is being mechanically suppressed, not genuinely resolved. This leaves the system fragile, asymmetric, and highly sensitive to small shocks.
Credit Lens — The Perimeter of the Entire Regime
Credit continues to define the system’s boundary conditions:
-
High yield remains contained but not tightening
-
IG credit remains firm but not expanding
-
The 7–10 year belly absorbs duration repositioning
-
Credit conditions stabilize, but do not energize the market
This week’s shift of duration demand into the belly is the single most important credit-adjacent signal: a structural hedge against growth fragility, not inflation.
Interpretation: Credit remains orderly, but its torque contribution is gone. It is a boundary, not a tailwind.
Global Liquidity Lens — A Ceiling, Not a Catalyst
The USD remains firm, and global liquidity readings remain sub-trend. Cross-border flows continue to compress, limiting valuation expansion outside high-density corridors such as U.S. AI and quality credit.
Interpretation: Global liquidity is not breaking the system — but it is not helping it either. Upside remains capped.
Behavioral Lens — Repositioning Without Conviction
Retail flows stay defensive. Institutional flows remain selective, narrow, and strongly skewed toward AI leadership and belly duration.
Sentiment — whether fearful or complacent — continues to lag the structural geometry of the market.
Interpretation: Behavior is noise. Structure remains signal.
Cross-Lens Synthesis — Late-Equilibrium in Full Expression
Across all lenses, the configuration is unmistakable:
-
Liquidity anchors the system
-
AI leadership drives torque
-
Duration in the 7–10 year belly redefines macro hedging
-
Momentum decays into absorption
-
Volatility is suppressed, not solved
-
Credit defines the outer perimeter
-
Microstructure tightens as participation narrows
-
Global liquidity caps expansion
This is the pure expression of late-equilibrium — a market operating through engineering, not enthusiasm.
Allocator Note
CAVS ≈ 0.80 — stable but increasingly expensive. Scalability remains confined to liquidity-dense, AI-anchored corridors.
Maintain:
-
high-quality equity exposures
-
AI + semiconductor leadership
-
IG carry
-
7–10 year duration overlays
-
defensive convexity structures
-
tight torque symmetry
Avoid:
-
EM duration
-
illiquid cross-border risk
-
beta outside high-density liquidity channels
-
Final Word — Stability Holds, but Only Through Its Strongest Pillars
The VMSI at 55.2 delivers a clear structural message: the market remains stable, but only because its most resilient architectures are carrying the full load. Nothing about this week’s data suggests deterioration — but nothing suggests self-sustaining momentum either. This is engineered stability, not organic expansion.
AI leadership is now the defining torque spine of the equity market. What began as a thematic acceleration has become the structural backbone that absorbs instability everywhere else. As liquidity narrows and microstructure tightens, AI-linked balance sheets have effectively taken on the role that breadth once played: stabilizing the index through concentration, not participation.
At the same time, the 7–10 year Treasury belly has become the market’s macro anchor, signaling a shift away from hedging inflation and toward hedging growth fragility and policy uncertainty. Investors are not panicking — they are reallocating with precision. The belly bid confirms the regime: this is a market preparing for slower forward growth, not crisis.
Surface volatility continues to mask these internal adjustments. The VIX reads calm, but internal volatility geometry — compression, skew steepening, elevated realized variance — reflects a system absorbing risk rather than resolving it. This is classic late-equilibrium behavior: quiet on the surface, costlier beneath it.
Liquidity remains functional but increasingly selective, flowing primarily into:
-
AI corridors
-
Quality balance sheets
-
IG carry structures
-
Duration overlays in the belly
Outside these channels, torque decay is unmistakable. Participation remains thin, breadth impaired, and elasticity reduced. The system still holds — but only where its architecture is strongest.
The implication is straightforward: continuation is still possible, but never broadly. This is a market rewarding discipline, precision, and alignment with the structural spine. The path forward is defined not by enthusiasm, but by engineering — the deliberate combination of liquidity density, duration support, and AI-driven torque.
The market is not breaking. But it is also not expanding. It is functioning through its strongest pillars while the rest of the system absorbs pressure. Stability persists — but the margin for error continues to narrow.
This is a market held together by design, not conviction.
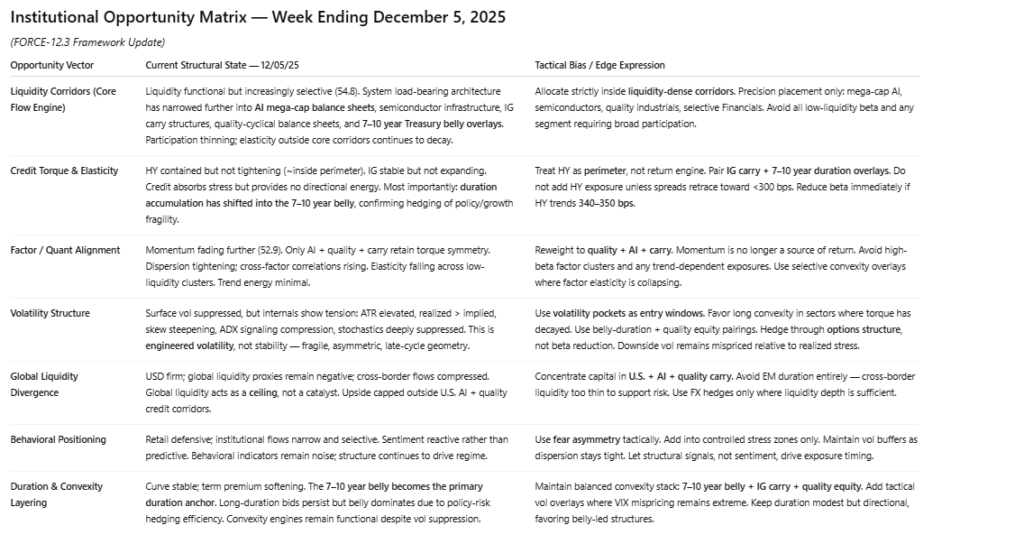
11. Institutional Opportunities — Precision Over Participation
The opportunity set this week remains defined by asymmetry, not expansion. The system continues to function — but only through elevated structural effort across liquidity, volatility suppression, and duration concentration. This is the classic late-equilibrium regime where broad beta fails and only precision, placement, and liquidity geometry produce return.
Opportunity is not a function of exposure. It is a function of where the structure is willing to carry risk.
Liquidity: Still Functional — Now Even More Selective
Liquidity at 54.8 remains stabilizing, but the system’s load-bearing architecture has narrowed further into a handful of deep corridors:
-
mega-cap AI balance sheets
-
semiconductor infrastructure
-
IG carry structures
-
quality cyclical balance sheets
-
7–10 year belly overlays anchoring duration hedging
These corridors retain torque symmetry; everything outside them exhibits progressive decay.
Opportunity: Allocate strictly inside liquidity-dense corridors. Elasticity elsewhere is insufficient and non-compounding.
Momentum: Fading Velocity = Forced Selectivity
Momentum at 52.9 confirms the system is losing inherent speed. Only sectors with embedded liquidity density — AI, quality industrials, select defensives — retain the torque needed for continuation.
Low-liquidity segments cannot sustain trend. Cyclicals and discretionary remain structurally disadvantaged.
Opportunity: Momentum is no longer a source of return. Only sectors with deep structural reinforcement can carry exposure forward.
Volatility: Suppressed Surface = Convexity Opportunity
The volatility complex is the most asymmetric opportunity in the entire market.
The VIX prints calm, but internal metrics reveal the opposite:
-
ATR elevated
-
realized vol > implied
-
skew steepening
-
vol stochastics suppressed
-
ADX confirming compression, not calm
This is not relief — it is engineered suppression.
Opportunity: Volatility pockets are entry windows, not signals to de-risk.
Preferred structures:
-
long convexity in sectors with torque decay
-
belly-duration overlays paired with quality equity
-
hedging through options structure, not beta reduction
-
tactical exposure to vol dislocations around AI earnings cycles
Downside vol remains cheap relative to realized stress.
Credit: The Boundary — Not the Catalyst
High yield remains inside the perimeter (contained, not tightening). IG credit remains firm but no longer improves. The belly absorbs duration repositioning; credit simply absorbs stress.
Credit no longer provides directional torque — it defines what the market cannot do.
Opportunity: Use IG carry + belly overlays as stabilizers, not return engines. Treat HY as a perimeter: A move toward 340–350 bps ends the opportunity set immediately.
Sector-Level Opportunity: AI, Quality, Duration Symmetry
Internal flow coherence remains strongest in:
-
Financials (selective, credit-anchored torque)
-
Industrials (balance-sheet strength + belly reinforcement)
-
AI infrastructure + semiconductors (structural torque spine)
-
Communication Services (best liquidity efficiency in the index)
-
Health Care (defensive convexity with rising inflows)
Weakest symmetry remains in:
-
Discretionary
-
Staples
-
Materials
-
Energy
Opportunity: Focus exclusively on sectors where liquidity is directional, balance sheets are torque-efficient, and internal flows remain reflexively reinforcing.
Regime-Specific Opportunity Map
Best opportunities (structurally reinforced):
-
AI mega-cap + semiconductor torque reservoirs
-
Quality-cycle industrials
-
IG carry + belly-duration overlays
-
Defensive convexity in Health Care & Comm Services
-
Selective Financials tied to stable credit
Conditional (requires credit + vol confirmation):
-
High-quality growth outside AI
-
Quality cyclical mid-caps
-
Select specialty tech with earnings visibility
Avoid (structurally inconsistent with this regime):
-
beta-dependent strategies
-
discretionary growth without liquidity depth
-
commodities lacking flow reinforcement
-
extended cyclicals with torque decay
-
illiquid EM proxies
What This Means for Institutional Allocators
This is a precision regime, not a beta regime. Wide exposure is a liability. Selective exposure is the only source of return.
Allocator Playbook:
-
Scale exposure only inside liquidity-dense corridors
-
Pair quality-factor equity with IG carry + 7–10 year belly duration
-
Exploit volatility dislocations created by surface-level suppression
-
Use convexity to hedge asymmetry, not index futures
-
Reduce risk immediately if HY approaches 340–350 bps
-
Demand breadth confirmation (>45%) before increasing beta
Structure determines opportunity. Not narrative. Not emotion. Not momentum.
Structural Takeaway
Opportunity exists — but only where the structure is doing the work. This market rewards discipline, not enthusiasm. Liquidity stabilizes the system, but each incremental unit of stability costs more than the last.
The edge lies in understanding where liquidity still carries force — and positioning ahead of the moment when the broader market realizes that participation is not returning.
Continuation is investable — but only through design, not direction.
Final Word — Stability Holds, but Only Through Its Strongest Pillars
The VMSI at 55.2 delivers a clear structural message: the market remains stable, but only because its most resilient architectures are carrying the full load. Nothing about this week’s data suggests deterioration — but nothing suggests self-sustaining momentum either. This is engineered stability, not organic expansion.
AI leadership is now the defining torque spine of the equity market. What began as a thematic acceleration has become the structural backbone that absorbs instability everywhere else. As liquidity narrows and microstructure tightens, AI-linked balance sheets have effectively taken on the role that breadth once played: stabilizing the index through concentration, not participation.
At the same time, the 7–10 year Treasury belly has become the market’s macro anchor, signaling a shift away from hedging inflation and toward hedging growth fragility and policy uncertainty. Investors are not panicking — they are reallocating with precision. The belly bid confirms the regime: this is a market preparing for slower forward growth, not crisis.
Surface volatility continues to mask these internal adjustments. The VIX reads calm, but internal volatility geometry — compression, skew steepening, elevated realized variance — reflects a system absorbing risk rather than resolving it. This is classic late-equilibrium behavior: quiet on the surface, costlier beneath it.
Liquidity remains functional but increasingly selective, flowing primarily into:
AI corridors Quality balance sheets IG carry structures Duration overlays in the belly
Outside these channels, torque decay is unmistakable. Participation remains thin, breadth impaired, and elasticity reduced. The system still holds — but only where its architecture is strongest.
The implication is straightforward: continuation is still possible, but never broadly. This is a market rewarding discipline, precision, and alignment with the structural spine. The path forward is defined not by enthusiasm, but by engineering — the deliberate combination of liquidity density, duration support, and AI-driven torque.
The market is not breaking. But it is also not expanding. It is functioning through its strongest pillars while the rest of the system absorbs pressure. Stability persists — but the margin for error continues to narrow.
This is a market held together by design, not conviction.
VICA Research Disclaimer
This report is for informational purposes only and does not constitute investment, legal, or tax advice. The VICA Market Sentiment Index (VMSI) and all related materials are proprietary and protected by intellectual property laws. Market views may change without notice, and past performance does not guarantee future results. All investments involve risk, including possible loss of principal. Unauthorized use or redistribution is strictly prohibited.
© 2025 VICA Partners — VMSI™ Proprietary FORCE-12.x Framework

