
Technical Analysis
September 17, 2023 by Doug Sooley and Matthew Krumholz
Key Market Indices for the Week of September 15, 2023
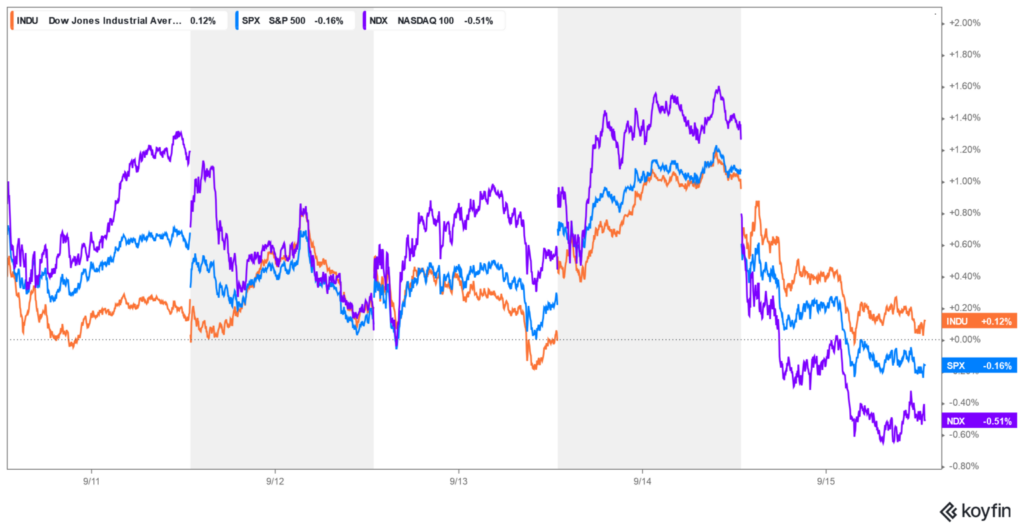
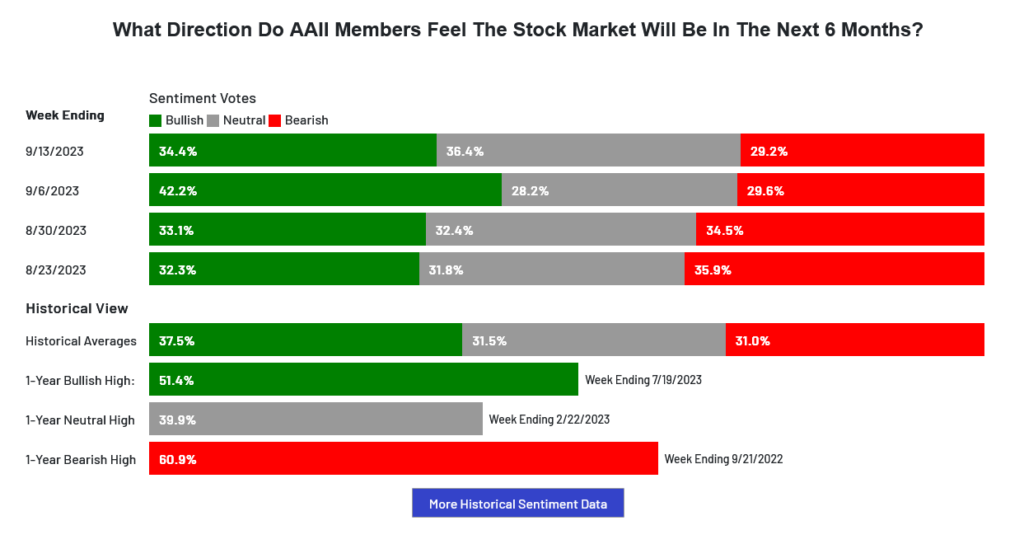
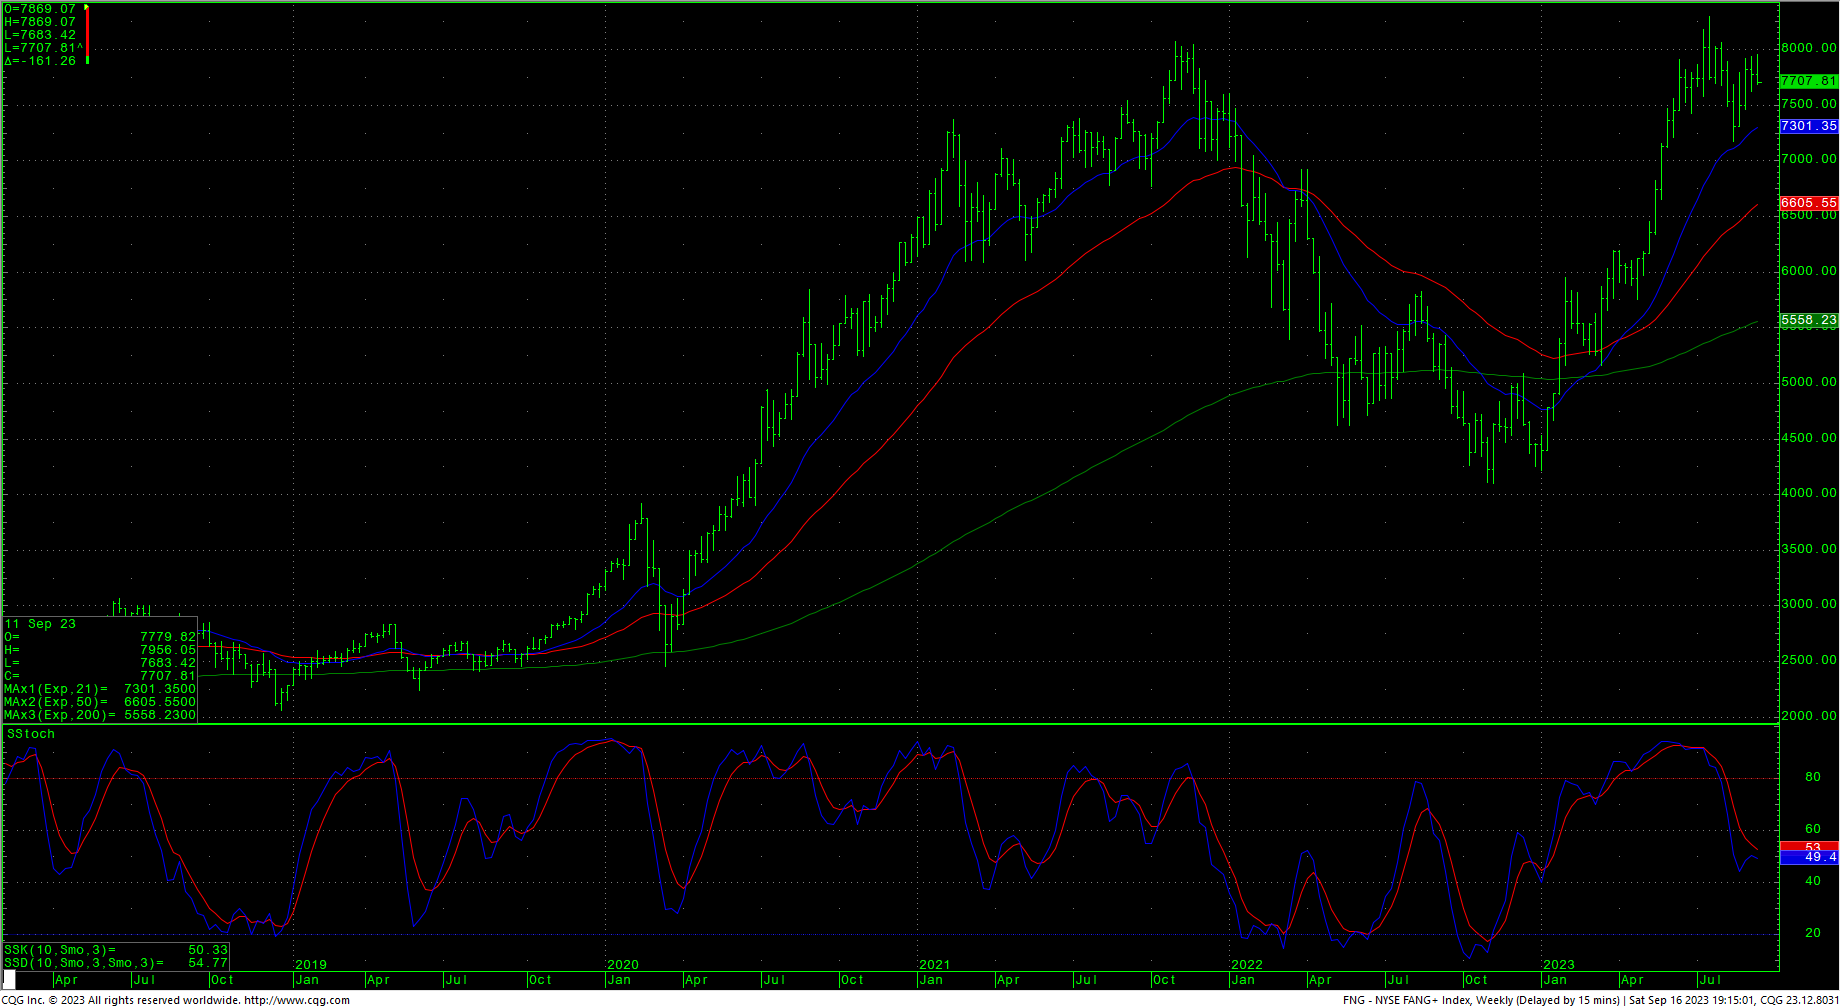
During a volatile week, stock markets saw losses across all indices, settling at the week’s lower end, partly influenced by Thursday’s timing coinciding with the past quarter’s Triple Witching event. Weekly charts are addressing overbought conditions, daily charts are mostly neutral, and hourly charts are slightly oversold by Friday’s close. Sentiment has shifted towards neutrality, but fear still prevails in the fund-related sector, as reflected in the AAII Sentiment Index hitting its highest neutral reading since May. The VIX remained flat, situated in the middle of the weekly range after reaching a 2.5-year low, and the 52-week A/D ratio dropped to -0.62%. The Put/Call ratio remained at 0.94 for the past month. The Dow closed the week down by -0.12%, the S&P by -0.16%, the Nasdaq by -0.39%, the FANG by -0.93%, and the Russell by -0.25%. In the bond market, a new weekly closing low was set, maintaining a deeply oversold status, with bonds reacting to a swing high on Thursday’s timing. Commodities saw a rally, with crude oil surpassing $90, metals staging a late rebound, and the US Dollar hitting a one-year high. The CRB closed up by +1.91%, while the Commitment of Traders CoT remained in a stagnant pattern, with inventories among major players remaining unchanged for almost two months.
Upcoming Timing Points:
-
09/22: **
-
09/28: *** (Extreme/Fast Moves)
AAII Investor Sentiment Survey
Dow Jones Industrial Average Hourly Highs, Lows, and Closes (HLC)
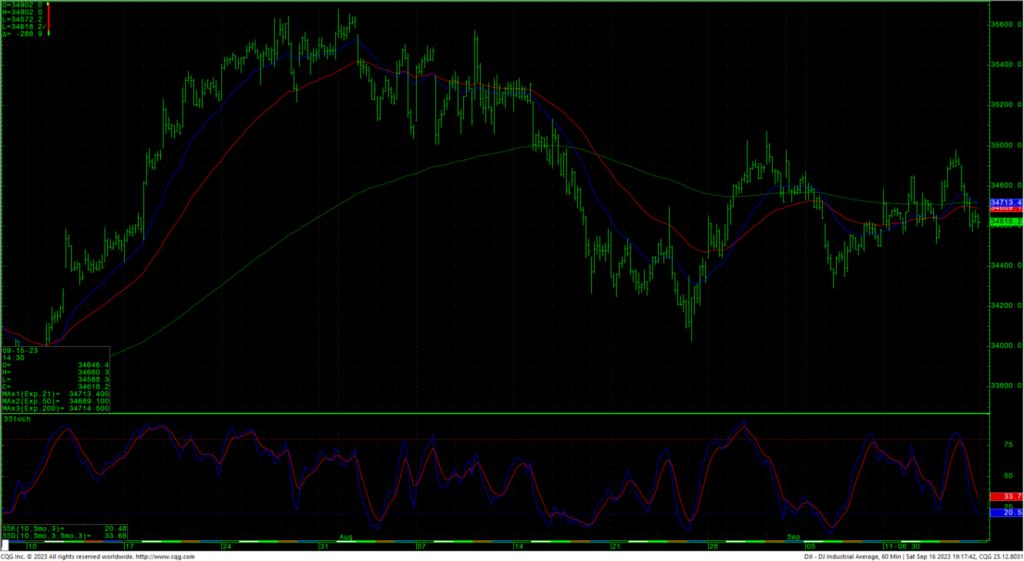
The Dow is currently slightly oversold on the hourly chart, and last week’s trading had minimal impact on the overall technical outlook; key support levels are found at 34549 and 34426/34420, while a further drop below 34420 could lead to retests at 34289/34274 and potentially 34022 with short-term critical support at 33767/33760, and daily closes below 33760 may target major short-term support in the 33359 through 33316 range, with potential moves down to 32998 and critical intermediate-term support at 32586/32580, suggesting a potential drop to 32170 with the possibility of reaching 31341/31330.
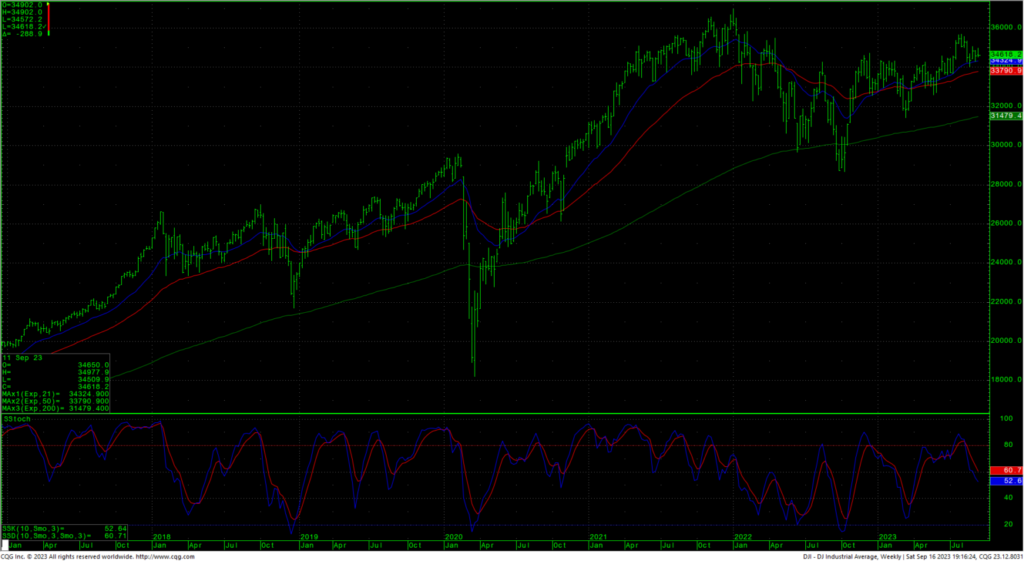
Resistance levels remain at 34659, 34854, and a short-term pivotal point at 35048/35055, and if rallies manage to close above 35055, it could signal a test of last-resort resistance at 35266/35289, potentially leading to a challenge of the trading highs at 35679, with intermediate counts projecting towards 35824 and longer-term counts indicating a gap area on the daily chart at 35996 to 36044, and a breakout beyond 36044 could set the stage for a move towards the 36513 area, with the potential to test the all-time record highs at 36952; it’s worth noting the presence of a larger inverted Head and Shoulders (H&S) pattern on the DJIA weekly chart, pointing to long-term targets at 37095.
Dow Jones Industrial Average Weekly Highs, Lows, and Closes (HLC)
Support
-
34549 ***
-
34426/34420 ***↓
-
34132 **
-
34020/34022 *** ↓
-
33865 **
-
33767/33760 *** ↓
-
33610 *** ↓
-
33537 **
-
33400/33399 *** ↓
-
33359 ** ↓
-
33316 ** ↓
-
33187 ** ↓
-
33091 *** ↓
-
32998 *** ↓
Resistance
-
34659 **
-
34854 *** ↑
-
34977 ** ↑
-
35048/35055 *** ↑
-
35266/35289 *** ↑
-
35354 ** ↑
-
35432 **
-
35578 ** ↑
-
35670 *** ↑
-
35800/35824 *** ↑
-
35996 ***
-
36044 *** ↑
-
36271 **
-
36390 **
-
36513 ***↑
-
36636 **
-
36934/36952 *** ↑
-
37095/37096 *** ↑
These levels for the Dow Jones Industrial Average are marked with asterisks, and directional indicators (↑ for upward movement and ↓ for downward movement) suggest potential price action associated with each level.
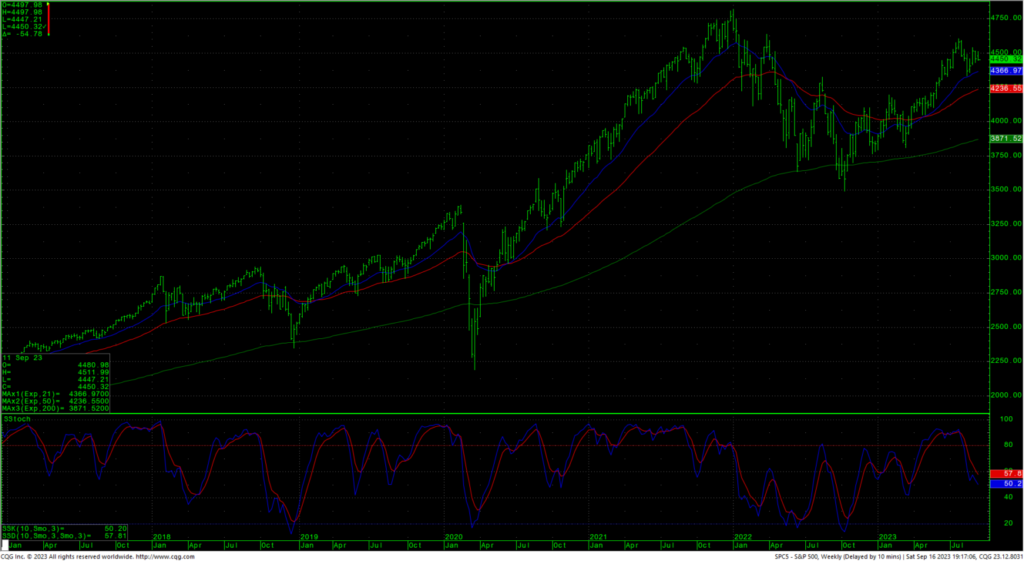
S&P 500 Cash Index
The S&P hourly chart currently exhibits slightly short-term oversold conditions while maintaining a neutral stance, with prices recently falling below a pivotal resistance level at 4503/4510. Resistance levels are noted at 4474 and 4503/4510, and if there are rallies that lead to closes above 4510, it may set the stage for a modest test of 4550 and 4575, with a bullish outlook for further testing of the swing high at 4607 upon closes above 4575. Additionally, closes over 4607 suggest the potential for a minimal test of 4637, and a breakout with closes above 4637 could open the door to further gains, potentially targeting 4748 and eventually 4818. Beyond the record highs, there’s the possibility of counts towards 4952/5000 with potential extensions to 5144.
On the support side, levels include 4434/4430 and a near-term pivotal point at 4413/4410. Closes below 4410 could lead to a test of 4328, and a breakdown with closes below 4328 could set the stage for a move to 4180/4177. Further declines below 4177 would open the path to support at 4049 and critical short-term support at 3917/3910. Daily closes below 3910 may indicate a potential move towards 3754/3750, with the possibility of finding support at 3503/3491.
S&P 500 Weekly High, Low, and Close Index (HLC)
Support
-
4434/4430 *** ↓
-
4413/4410 *** ↓
-
4380 **
-
4356 **
-
4335/4328 *** ↓
-
4304 **
-
4280 **
-
4261 *** ↓
-
4180/4177 *** ↓
-
4049 *** ↓
-
3917/3910 *** ↓
-
3875 **
-
3754/3750 *** ↓
-
3625 **
-
3500/3491 *** ↓
Resistance
-
4474/4475 ** ↑
-
4503/4511 *** ↑
-
4527 **
-
4541 **
-
4550 *** ↑
-
4575 *** ↑
-
4593 **
-
4607 *** ↑
-
4637 *** ↑
-
4665 **
-
4748 *** ↑
-
4818 *** ↑
-
4952 *** ↑
-
5000 *** ↑
-
5072 **
-
5144 *** ↑
These levels for the S&P 500 are marked with asterisks, and directional indicators (↑ for upward movement and ↓ for downward movement) suggest potential price action associated with each level.