Market Regime, Risk Repricing Decoupled from Credit Stability
March 19, 2026
Matthew Krumholz
Week Ahead
Executive Takeaway
Markets are undergoing risk recalibration rather than structural deterioration. Equity momentum weakened across major indices while volatility remains elevated and credit spreads widened modestly. Treasury markets remain orderly and funding conditions remain stable.
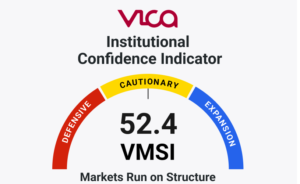
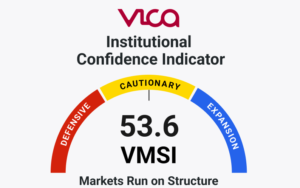
The VICA Institutional Market Sentiment Index (VMSI) increased to 54.9, indicating continued institutional participation despite higher volatility.
VMSI is a proprietary framework that synthesizes cross-asset signals including volatility regimes, credit spreads, liquidity flows, and institutional positioning to identify shifts in market structure.
The central signal this week is the divergence between weakening equity momentum and stable institutional sentiment, indicating exposure adjustment and hedging rather than capital withdrawal.
Structural Signal: Institutional positioning remains defensive but stable, with volatility hedging elevated while credit and funding markets remain orderly. This configuration historically precedes consolidation rather than systemic risk escalation.
VMSI Regime Signal: Stabilization following recent volatility repricing.
Capital Positioning Signal
Current signals suggest institutions are reducing marginal equityexposure while maintaining core allocations, with volatility hedging elevated while credit markets continue to signal systemic stability.
CIO Decision Snapshot
Market Regime: Risk recalibration with stable liquidity conditions.
Primary Risk Signal: Elevated volatility, with VIX at 27.19, while credit markets remain orderly — indicating hedging activity rather than systemic capital withdrawal.
Near-Term Catalyst: Federal Reserve policy guidance and Treasury yield behavior following the upcoming FOMC decision.
Market Regime Snapshot
VMSI Sentiment: 54.9 — Neutral / Cautionary
VMSI has remained above the Neutral threshold for 53 consecutive weeks, indicating institutional risk positioning has stabilized despite elevated volatility.
Equity Structure: Short-term weakness with intact long-term trend. The S&P 500 remains above its 200-day structural support near 6,604.
Risk Transmission: Increased hedging activity with stable liquidity conditions.
VMSI Historical
The VMSI tracks institutional risk posture across volatility, credit, liquidity, and macro signals. Over the past year the index has moved through four identifiable phases: structural recovery, peak sentiment expansion, volatility repricing, and the current neutral regime.
VMSI vs. VIX vs. S&P 500
The relationship between VMSI, volatility, and equity performance shows institutional sentiment stabilizing despite elevated volatility.
Market Structure
Major equity indices weakened across short-term trend windows.
The S&P 500 closed at 6,632, trading below its 5-, 20-, and 50-day averages while remaining above the 200-day trend near 6,604. Momentum indicators show downside pressure with RSI near 33.
The Nasdaq Composite closed at 22,105, trading 5.6% below the 50-day average while remaining 15.1% above the 200-day trend.
The Dow Jones Industrial Average closed at 46,558, with RSI near 28, reflecting cyclical weakness.
Small-cap equities continue to show higher sensitivity to tightening liquidity. The Russell 2000 closed at 2,480, trading 4.9% below its 20-day average while remaining 18.7% above the 200-day trend.
When indices decline below short-term averages while long-term structure and credit markets remain intact, markets typically transition into short consolidation regimes rather than systemic breakdown.
Volatility Regime
Volatility remains elevated following the recent repricing cycle.
The VIX closed at 27.19, approximately 30% above its 20-day average and nearly 90% above its 50-day average.
The broader volatility complex indicates stabilization rather than acceleration. The VVIX closed near 131, while the Nasdaq volatility index (VXN) closed near 29.9, indicating sustained but non-accelerating hedging demand.
The SKEW index declined to 137.8, now below intermediate averages, indicating reduced demand for extreme tail-risk protection.
System Stability Check: Treasury volatility remains contained while equity volatility stabilizes, indicating that hedging demand remains concentrated in equity markets rather than spreading across the broader financial system.
Rates and Duration
Treasury markets remain structurally stable.
The 1–3 Year Treasury ETF (SHY) closed at 82.55, trading near its long-term trend with low realized volatility near 1–2%.
Intermediate duration Treasuries show modest repricing. The 7–10 Year Treasury ETF (IEF) closed at 95.59, trading 1.3% below its 20-day average while remaining above the 200-day trend.
Long-duration bonds absorbed most of the adjustment. The 20+ Year Treasury ETF (TLT) closed at 86.54, trading 3.0% below its 20-day average and 5.1% below its 100-day average, while remaining near structural support.
Convex duration exposures show similar adjustments. EDV trades 4.2% below its 20-day average and ZROZ 4.4% below.
Treasury markets therefore reflect orderly duration repricing rather than liquidity disruption.
Credit Conditions
Credit markets weakened modestly but remain functional.
The High Yield Corporate Bond ETF (HYG) closed at 79.20, trading 2.0% below its 20-day average and 1.9% below its 50-day average, while remaining near its 200-day trend.
Momentum indicators show RSI near 28, indicating tactical spread widening rather than structural credit deterioration.
Investment-grade credit shows similar behavior. The LQD ETF closed at 108.17, trading 2.7% below its 20-day average.
Short-duration high yield (SJNK) and emerging-market debt (EMB) declined modestly. Volatility across the credit complex remains below levels historically associated with funding stress.
Equity weakness accompanied by moderate credit deterioration typically indicates risk recalibration rather than systemic instability.
Factor Rotation
Factor dispersion continues across equities.
Value equities remain structurally stronger. The Vanguard Value ETF (VTV) closed at 197.27, trading above its 50-, 100-, and 200-day averages.
Growth equities remain under pressure. The Vanguard Growth ETF (VUG) closed at 450.21, trading 8.4% below its 50-day average and 5.9% below its 100-day average.
Institutional capital continues rotating toward lower duration exposure and stronger balance-sheet profiles.
Global Risk Signals
Global equity markets weakened during the week.
Emerging markets (EEM) closed at 56.80, trading 6.7% below the 20-day average while remaining above longer-term structural support.
Japanese equities (EWJ) declined more sharply, trading 10.7% below the 20-day average while remaining above the 200-day trend.
China remains structurally weaker, with FXI trading below intermediate trend levels.
The U.S. Dollar Index strengthened to 100.36, trading above all major averages with RSI near 73.
Dollar strength combined with emerging-market weakness indicates tightening global liquidity conditions.
Gold remains structurally supported. GLD trades more than 15% above its 50-day average and over 50% above its 200-day trend, reflecting continued safe-haven allocation.
Economic Backdrop
Recent economic data shows stable inflation with moderating growth.
Headline CPI increased 0.3% month over month and 2.4% year over year, while core CPI increased 0.2%.
Growth data weakened. Q4 GDP was revised to 0.7% from a 1.5% expectation.
Consumer activity remains stable. Personal income increased 0.4% and consumer spending increased 0.4%.
Labor demand remains intact with job openings at 6.9 million.
Housing data surprised positively. Housing starts increased to 1.49 million versus 1.35 million expected.
Overall conditions reflect late-cycle deceleration rather than contraction.
VICA Institutional Market Sentiment Index (VMSI)
Institutional sentiment remained stable despite increased volatility.
Current VMSI Scores – 3/13/26
The divergence between declining momentum and stable sentiment indicates defensive repositioning rather than capital exit.
Bottom Line
Markets are repricing risk rather than signaling systemic instability.
Equity momentum weakened while volatility increased, with VIX holding near 27, and credit spreads widened modestly. Treasury markets remain orderly and liquidity conditions remain stable.
This configuration historically leads to range-bound consolidation, provided credit conditions remain functional and volatility stabilizes.
The next directional shift will depend primarily on Federal Reserve policy signaling and Treasury yield behavior following the upcoming FOMC decision.
About the VICA Institutional Market Sentiment Index (VMSI)
The VICA Institutional Market Sentiment Index (VMSI) is a proprietary framework designed to track shifts in institutional risk behavior across global markets.
The index integrates cross-asset signals including momentum, liquidity flows, volatility hedging demand, credit conditions, and safe-haven allocation trends.
VMSI scores are generated through a systematic model combining volatility regimes, credit spreads, liquidity flows, macroeconomic signals, and institutional positioning indicators to identify shifts in market structure.
VMSI operates on a 0–100 scale reflecting shifts in institutional risk posture:
0–25: Systemic Risk / Defensive Positioning
26–49: Elevated Risk / Cautious Allocation
50–74: Neutral / Balanced Institutional Exposure
75–100: Expansion / High Institutional Risk Appetite
Unlike retail sentiment indicators, the VMSI measures institutional positioning and capital flow dynamics to help investors anticipate potential inflection points in market regimes.
Important Notice
This report and the proprietary VICA Institutional Market Sentiment Index (VMSI) are confidential works of authorship protected by intellectual property laws. Unauthorized reproduction, redistribution, or use without express permission from VICA Research is prohibited.
This material is provided for informational purposes only and does not constitute investment advice.
VICA Research
The VICA Research platform and VMSI dashboard will relaunch in April 2026, introducing expanded institutional data tools, cross-asset analytics, and deeper access to proprietary sentiment indicators.
Capital does not follow headlines. It follows structure.
Week Ahead Executive Takeaway Markets are transitioning from risk recalibration into accelerating internal deterioration, not structural breakdown. Equity momentum weakened...
Week Ahead Executive Takeaway Markets are transitioning from risk recalibration into early-stage internal deterioration, not structural breakdown. Equity momentum weakened...