Institutional Conditions Strengthened. Participation Remained Selective.
July 14, 2026
Matthew Krumholz
VMSI™ Weekly Institutional Market Report
Week Ending July 10, 2026
Opening Summary
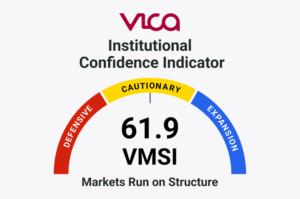
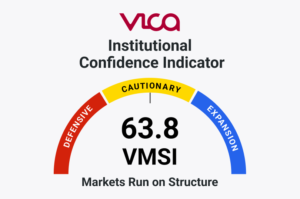
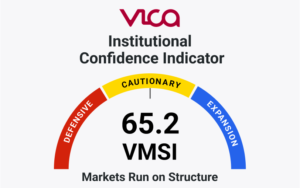
Institutional market conditions improved as equity volatility declined, high-yield credit remained constructive, reserve liquidity increased, and global propagation strengthened through emerging-market participation. The VMSI™ Composite rose to 65.7 from 65.2, reflecting measured improvement across several independently confirmed dimensions of market structure.
The improvement remained selective. Capitalization-weighted indexes strengthened while equal-weight equities and small caps weakened. Treasury volatility increased, long-duration bonds remained under pressure, and matched equity-versus-bond ETF flow data were unavailable for the reporting cutoff.
VMSI™ therefore retained the Selective Synchronization Expansion regime, with stronger institutional conditions but increasingly concentrated participation.
Live Report Link
Live Report: vicapartners.com
VMSI™ Snapshot Table
VMSI™ Framework
July 3, 2026
July 10, 2026
Weekly Change
Validation Comment
VMSI Composite
65.2
65.7
+0.5
Lower equity volatility, tighter high-yield spreads, improved liquidity, and constructive global participation supported a modest increase.
Momentum
69.7
70.1
+0.4
Large-cap momentum strengthened, while weaker small-cap and equal-weight participation limited the advance.
Liquidity
62.7
63.1
+0.4
Credit conditions remained orderly and reserve liquidity improved despite continued pressure on long-duration bonds.
Volatility & Hedging
60.8
61.6
+0.8
Equity volatility declined while institutional portfolio hedging and tail-risk protection remained intact.
Safe Haven Demand
48.2
47.7
−0.5
Gold and the dollar showed limited defensive demand, while stronger oil prices preserved some inflation and geopolitical risk premium.
Advanced Framework Layer Table
Advanced Framework
July 3, 2026
July 10, 2026
Weekly Change
Institutional Comment
SPI
68.4
68.0
−0.4
Index strength masked weaker participation integrity as equal-weight and small-cap performance lagged.
CMX
60.1
60.8
+0.7
Equity volatility compressed and credit remained orderly, although Treasury volatility increased.
PDCS
72.1
72.3
+0.2
Institutional capital remained deployable despite duration pressure and incomplete flow confirmation.
GFP
66.2
66.6
+0.4
Global propagation improved through emerging-market participation rather than uniform developed-market strength.
PLMT
Selective Synchronization Expansion
Selective Synchronization Expansion
—
The regime persisted, with stronger institutional conditions but increasingly concentrated participation.
IC-VMSI™
69.6
69.8
+0.2
Institutional capital deployment remained constructive, although final fund-flow confirmation was incomplete.
Executive Summary
The VMSI™ Composite increased to 65.7 from 65.2 as Momentum rose to 70.1, Liquidity advanced to 63.1, and Volatility & Hedging increased to 61.6. Safe Haven Demand declined to 47.7 as gold weakened modestly and the dollar showed limited defensive demand.
The improvement was supported by lower equity volatility, tighter high-yield spreads, stronger reserve liquidity, and constructive global participation. High-yield option-adjusted spreads tightened by four basis points, while investment-grade spreads remained essentially stable. Reserve balances increased by approximately $132 billion as the Treasury General Account declined by approximately $106 billion.
Participation quality weakened beneath the headline indexes. The S&P 500 and Nasdaq advanced, while the Dow, Russell 2000, and equal-weight equities lagged. PIR™ declined approximately 1.63%, confirming that market strength became more concentrated in capitalization-weighted and growth-oriented leadership.
Independent confirmation remained constructive but incomplete. Treasury volatility increased, long-duration assets weakened, institutional hedging remained active, and matched weekly flow data were unavailable for DFR™. These constraints prevented a transition into fully synchronized institutional expansion.
Structural Conclusion: Institutional conditions strengthened while participation remained selectively concentrated.
Market Structure
Large-cap momentum strengthened while broader participation weakened. The S&P 500 advanced 1.2% and the Nasdaq Composite rose 1.7%, while the Dow declined 0.5% and the Russell 2000 fell 0.6%.
The Participation Integrity Ratio—PIR™ = RSP ÷ SPY—declined to 0.28386, approximately 1.63% below the prior-week reading. Equal-weight equities weakened while capitalization-weighted exposure advanced, indicating that the largest companies contributed disproportionately to index performance.
Growth leadership reinforced the same structure. VUG advanced 2.22%, while VTV was essentially unchanged. Market breadth remained constructive, with 62.22% of S&P 500 constituents above their 20-day moving averages, 67.79% above their 50-day averages, and 65.80% above their 200-day averages. New highs exceeded new lows by 12 to 4.
The combination indicates that institutional capital remained committed to equities but became more selective. Healthy breadth prevented the structure from becoming narrowly fragile, yet weaker equal-weight and small-cap participation prevented confirmation of broad synchronization.
Structural Conclusion: Selective institutional leadership strengthened while broad synchronization remained incomplete.
Credit & Liquidity Conditions
Credit conditions remained orderly despite visible weakness in investment-grade bonds and continued pressure across the Treasury duration complex.
The Credit Quality Ratio—CQR™ = LQD ÷ HYG—declined to 1.34814, approximately 1.09% below the prior-week reading. HYG remained essentially unchanged while LQD declined 1.09%. The ratio movement reflected the relative resilience of high yield rather than deterioration in lower-quality credit.
High-yield OAS tightened from 274 to 270 basis points, while broad investment-grade OAS moved only from 75 to 76 basis points. Treasury losses increased consistently with duration, ranging from a 0.07% decline in SHY to losses of 1.95% in EDV and 2.25% in ZROZ.
Federal Reserve data provided independent liquidity confirmation. Average reserve balances increased by approximately $132 billion, while the Treasury General Account declined by approximately $106 billion. Federal Reserve total assets increased by only about $11 billion, indicating that liquidity improved primarily through Treasury cash-account mechanics rather than broad monetary expansion.
Bond prices weakened, but the underlying credit structure remained intact. The market repriced interest-rate sensitivity more aggressively than default risk, while the reserve increase supported a modest improvement in system liquidity.
Structural Conclusion: Corporate-credit functioning remained intact as liquidity improved through Treasury cash mechanics rather than broad monetary expansion.
Positioning & Convexity
Equity implied volatility declined, but institutional hedging and cross-asset risk protection remained active.
VIX closed at 15.03, while VVIX and VXN declined to 87.28 and 24.89. These readings indicated lower demand for immediate equity and technology volatility protection.
The Hedging Preference Ratio—HPR™ = CPCE ÷ CPCI—was 0.54455 and remained essentially unchanged. CPCE closed at 0.55, while CPCI remained higher at 1.01, confirming that portfolio-level index hedging continued to exceed single-stock hedging.
SKEW remained elevated at 144.27, while MOVE increased 6.35% to 69.55. A model-derived dealer-gamma estimate also indicated a strongly positive positioning regime, consistent with market-making flows that can dampen realized equity volatility.
The decline in headline volatility therefore did not represent an abandonment of protection. Investors reduced near-term equity-volatility demand while maintaining index hedges, tail protection, and rates-risk coverage.
Structural Conclusion: The volatility structure was constructive but guarded rather than complacent.
Flow & Allocation Behavior
Institutional capital remained deployable, but the weekly flow-confirmation layer was incomplete.
The Deployment Force Ratio—DFR™ = Equity ETF Flows ÷ Bond ETF Flows—could not be calculated because matched equity and bond ETF totals were unavailable for the same July 10 reporting cutoff. No prior-period or mismatched dataset was substituted.
Other deployment measures remained constructive. PDCS increased to 72.3, while IC-VMSI™ advanced to 69.8. Stable high yield, tighter HY OAS, stronger reserve liquidity, and resilient benchmark-linked equity exposure indicated continued institutional capacity to deploy capital.
Available fund-level observations suggested mixed creations and redemptions across equities, bonds, style exposure, and corporate credit. Because those observations did not share a uniform final-week cutoff, they remained provisional and were not used to establish a definitive equity-versus-bond allocation preference.
The broader evidence did not indicate forced de-risking, but the absence of DFR™ limited the strength of the deployment conclusion.
Structural Conclusion: Institutional capital deployment remained constructive without full confirmation from matched weekly flow data.
Global Propagation Conditions
Global participation strengthened through emerging-market exposure rather than through uniform developed-market leadership.
The Global Propagation Ratio—GPR™ = VEA ÷ VWO—declined to 1.18534, approximately 1.17% below the prior-week reading. VWO advanced approximately 1.44%, while VEA gained approximately 0.25%, confirming emerging-market outperformance.
EEM and IEMG also advanced, while China produced a strong short-term rebound. Japan remained constructive, but EFA was approximately unchanged, indicating that developed-market participation was less uniform.
The dollar rose only modestly and did not prevent emerging-market strength. Gold declined 0.30%, while WTI and Brent advanced approximately 4.0% and 5.4%, preserving an inflation and geopolitical risk premium without producing a broad flight into traditional safe havens.
Global capital propagation improved, but the improvement remained regional and selective rather than synchronized across developed and emerging markets.
Structural Conclusion: Global propagation improved without transitioning into full synchronization.
Advanced Signal Layer
The Advanced Framework improved in aggregate, but its internal components remained uneven.
CMX rose to 60.8, PDCS increased to 72.3, GFP advanced to 66.6, and IC-VMSI™ increased to 69.8. SPI declined to 68.0 as weaker equal-weight and small-cap participation reduced the integrity of headline index strength.
The relationship metrics independently identified the same structure. PIR™ exposed weaker participation integrity. CQR™ distinguished duration pressure from credit deterioration. HPR™ confirmed that institutional portfolio hedging remained active. GPR™ identified emerging-market leadership within global propagation. DFR™ remained unavailable because matched weekly flow data were not published.
The signals therefore did not describe a uniform risk-on transition. Volatility, liquidity, credit, and global propagation improved, while participation became more concentrated and duration pressure persisted.
Taken together, the Advanced Signal Layer continued to support the Selective Synchronization Expansion regime without confirming a transition into fully coordinated institutional expansion.
Structural Conclusion: Independent structural signals strengthened selectively, but full institutional confirmation remained incomplete.
Structural Discoveries
1. Price strength masked weaker participation integrity. Capitalization-weighted indexes advanced while equal-weight and small-cap exposure weakened. PIR™ confirmed that headline performance overstated the breadth of institutional participation.
2. Bond weakness remained primarily duration-driven. LQD weakened while HYG remained stable and HY OAS tightened. Corporate-bond prices declined without evidence of a material deterioration in underlying credit risk.
3. Lower equity volatility did not mean hedging disappeared. VIX, VVIX, and VXN declined, but index hedging, SKEW, MOVE, and tail-risk protection remained active. The market was stable, but not unprotected.
4. Global propagation strengthened selectively. Emerging markets outperformed developed markets, lowering GPR™. International participation improved without becoming uniform across regions.
5. Liquidity improved through Treasury cash mechanics. Reserve balances increased as the Treasury General Account declined, while Federal Reserve assets changed only modestly. The liquidity impulse was operational rather than a broad monetary-regime shift.
Structural Conclusion: Hidden-state evidence showed improving institutional conditions beneath concentrated participation, active risk control, orderly credit, and selective global propagation.
Final Institutional Assessment
The independent evidence converged on a measured improvement in institutional market organization. The VMSI™ Composite increased to 65.7 as liquidity strengthened, equity volatility declined, high-yield credit remained constructive, and global propagation improved.
The improvement was not uniformly distributed. PIR™ weakened as equal-weight and small-cap exposure lagged. Treasury volatility increased, duration-sensitive assets declined, and institutional hedging remained active. The absence of matched weekly equity and bond ETF flow data also limited confirmation of a broader allocation acceleration.
The relationships revealed what headline prices did not. Equity gains reflected increasingly concentrated leadership. Corporate-bond weakness reflected duration pressure rather than deteriorating credit quality. Lower equity volatility coexisted with continued portfolio and tail-risk protection. Global participation strengthened through emerging markets rather than through uniform regional sponsorship.
Institutional capital remained active, liquidity remained orderly, and credit markets showed no evidence of systemic deterioration. However, concentration, duration pressure, active hedging, and incomplete flow confirmation continued to prevent a fully synchronized expansion.
Structural Conclusion: Institutional market organization improved, but participation and confirmation remained selective.
Regime Assessment: The institutional market regime remains Selective Synchronization Expansion, characterized by improving cross-market conditions, concentrated leadership, active hedging, orderly credit, and selective global propagation.
About VMSI™
The VICA Institutional Market Sentiment Index (VMSI™) is an observational market framework that measures the institutional conditions shaping market behavior before those conditions become fully reflected in prices.
Rather than analyzing individual indicators in isolation, VMSI™ measures the relationships among participation, liquidity, credit, positioning, capital deployment, and global propagation to identify the underlying organization of institutional markets.
Each weekly publication integrates observable market data, proprietary relationship metrics, and independent structural validation to estimate the current institutional market regime.
IC-VMSI™—Institutional Capital VMSI—measures institutional capital deployment through ownership, allocation, portfolio positioning, and benchmark-linked investment behavior.
The framework estimates institutional capital deployment across markets using observable evidence rather than individual trade reporting.
Disclaimer
VMSI™ is a proprietary observational market framework developed by VICA Research. This publication is provided for informational purposes only and does not constitute investment advice or a recommendation to buy or sell any security.
Conclusions reflect evidence-based interpretations of available market information at the time of publication and may change as new evidence becomes available.
Opening Summary Institutional market conditions weakened as reserve liquidity contracted, US equity momentum softened, and Treasury-duration pressure increased. The VMSI™...
Opening Summary Institutional market conditions weakened as equity volatility increased, technology leadership deteriorated, and global participation softened. The VMSI™ Composite...
Week Ending July 3, 2026 Institutional market conditions improved as participation broadened, credit remained orderly, and capital deployment continued across...