Institutions Are Buying Again. Commitment Has Not Followed.
April 11, 2026
Matthew Krumholz
VMSI REPORT 04-10-26
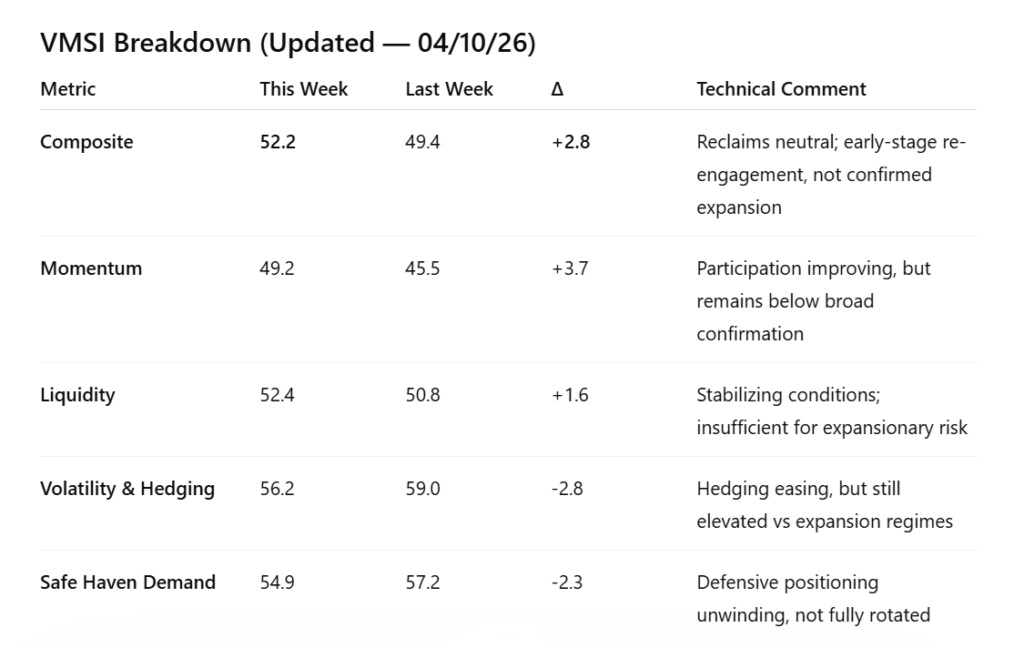
VMSI Snapshot
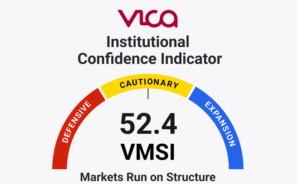
The VMSI increased to 52.2 (+2.8 WoW), driven by improving credit conditions and renewed equity inflows.
Momentum: 49.2
Liquidity: 52.4
Volatility & Hedging: 56.2
Safe Haven Demand: 54.9
The index has moved back above neutral, but remains below expansionary levels.
Executive Summary
High yield spreads tightening to 2.90% (−23 bps) and +$17.9B equity inflows confirm re-engagement, but +$8.9B bond flows and CPCI at 0.98 show positioning has not rotated.
HY OAS: 2.90% (−23 bps WoW)
Equity ETF flows: +$17.9B
Bond ETF flows: +$8.9B
CPCI: 0.98 | CPCE: 0.68
The data reflects a market reopening to risk, but still structurally cautious.
Capital is moving. Conviction is not.
VMSI
VMSI Index 4-10-26
Market Structure Analysis
Credit Conditions
High yield OAS at 2.90% (−23 bps) marks a material easing in financial stress, but remains above expansion thresholds.
High Yield OAS: 2.90% (−23 bps WoW)
Investment Grade OAS: 0.83% (−4 bps WoW)
This improvement stabilizes financing conditions, but does not yet confirm broad risk acceptance.
Credit is stabilizing, not confirming expansion.
Flow Data (Confirmation Layer)
+$17.9B equity inflows alongside +$8.9B bond inflows indicate participation without reallocation.
Equity ETF flows: +$17.9B
Bond ETF flows: +$8.9B
Institutions are adding exposure, but not shifting portfolios.
Buying returned. Rotation did not.
Equity Factor Rotation
Value leadership (+5.4% YTD VTV) and growth weakness (−5.5% YTD VUG) confirm defensive allocation bias.
VTV: +5.4% YTD, above trend
VUG: −5.5% YTD, below 50D / 100D
Leadership remains anchored in durability, not beta.
Exposure increased. Risk appetite did not.
Positioning & Hedging
CPCI at 0.98 and CPCE at 0.68 show hedging has declined, but remains above expansionary levels.
CPCE: 0.68
CPCI: 0.98
Institutions are reducing protection incrementally, not removing it.
Protection is reduced, not removed.
What Changed This Week
HY spreads tightening (−23 bps) and +$17.9B equity flows mark improving conditions, but CPI at 0.9% and persistent bond demand constrain transition.
HY OAS: −23 bps → 2.90%
Equity flows: +$17.9B
Small caps: ~+4% weekly
CPI: 0.9% MoM
Bond flows: +$8.9B
The pace of improvement accelerated, but macro constraints remain binding.
Signals are improving, but not aligned across asset classes.
The system is stabilizing, not synchronizing.
What Most Are Missing
Credit at 2.90%, balanced flows (+$17.9B / +$8.9B), and CPCI at 0.98 show stabilization—not expansion.
Credit improved, but not expansionary
Flows returned, but remain balanced
Hedging declined, but persists
The improvement is real, but incomplete.
Conditions improved. Belief did not.
Bottom Line
HY OAS (2.90%), flows (+$17.9B equities / +$8.9B bonds), and CPCI (0.98) confirm re-engagement without full commitment.
HY OAS: 2.90% (−23 bps)
Equity flows: +$17.9B
Bond flows: +$8.9B
CPCI: 0.98
Markets are stabilizing, but not transitioning.
Institutions are buying again. Commitment has not followed.
Access the Full Institutional Report
The full VMSI report — including factor-level breakdowns, regime probabilities, and forward positioning signals used by institutional allocators — will be available with the VICA Partners relaunch this week.
The relaunch introduces an institutional platform focused on real-time sentiment tracking, capital flow analysis, and cross-asset structure for allocation decisions.
VICA Partners Research
About the VICA Institutional Market Sentiment Index (VMSI)
The VMSI is VICA Research’s proprietary sentiment gauge designed to track shifts in institutional risk behavior, capital flow posture, and macro-driven volatility signals.
Each weekly score reflects a multi-factor model that incorporates market structure, liquidity dynamics, defensive rotation, and volatility hedging.
Index Scale
0–25: Critical Risk Zone
26–49: Defensive
50–74: Cautionary Optimism
75–100: Expansion / High Confidence
Important Notice
This report and the proprietary VICA Market Sentiment Index (VMSI) are confidential and protected. Unauthorized use is prohibited.
VICA Research
Capital does not follow headlines. It follows structure.