VMSI™ | August 28, 2026 — Participation Narrowed. Institutional Support Rotated.
August 31, 2026
Matthew Krumholz
Major-cap indexes advanced while short- and intermediate-horizon participation weakened and observable ETF deployment lost breadth. Credit spreads tightened, Treasury duration strengthened, and surface volatility eased. The institutional system remained selectively synchronized because support rotated from new deployment toward credit and cross-asset transmission.
VMSI™ Snapshot
Indicator
Score
Weekly Change
Institutional State
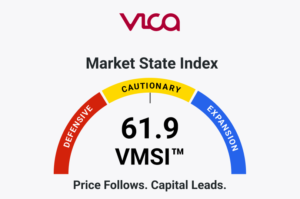
VMSI™ Composite
62.8
−0.4
Participation and observable ETF deployment weakened, while credit repair, duration strength, and lower surface volatility contained the systemic decline.
Momentum
66.0
−1.0
Major-cap indexes advanced, but short- and intermediate-horizon breadth, equal-weight participation, and small caps weakened; deeper trend structure remained intact.
Liquidity
57.4
−0.8
Reserve balances and Federal Reserve assets contracted while a smaller Treasury-cash release provided only a partial liquidity offset.
Volatility & Hedging
61.2
+0.4
Surface equity and rates volatility eased, but higher tail-risk skew, stronger put demand, and mixed dealer models limited improvement.
Safe Haven Demand
51.4
+0.4
Treasury duration, dollar strength, and gold ETF creation activity offset the gold-price reversal, leaving defensive demand rotated rather than synchronized.
Advanced Framework Layer
Framework
Score
Weekly Change
Institutional State
SPI
64.2
−2.6
Short- and intermediate-horizon breadth deteriorated further while long-horizon participation remained comparatively resilient.
CMX
60.4
+0.4
Surface and rates volatility normalized, but tail-risk asymmetry, increased put activity, and uncertain dealer stabilization prevented a larger improvement.
PDCS
70.2
+0.2
Credit repair and duration strength narrowly outweighed weaker reserve liquidity and less constructive aggregate ETF deployment.
GFP
68.6
−0.4
Broader emerging markets and Japan remained constructive, but China reversed, developed-market synchronization remained weak, and the dollar strengthened.
IC-VMSI™
67.2
−0.4
Observable capital remained active but became less uniformly constructive across benchmark, growth, and corporate-credit structures.
PLMT
—
—
Selective Synchronization Expansion
Signal Integrity
Confirmed evidence includes U.S. index performance, all five locked Breadth Version 2.0 measures, Treasury-duration structure, equity and rates volatility, Cboe put/call ratios, Federal Reserve liquidity conditions, corporate-credit spreads, global transmission, the dollar, gold, oil, and observable ETF creation-and-redemption activity.
Observation conventions remained separate. U.S. market and breadth observations use the August 28 close. Federal Reserve reserve balances and the Treasury General Account are weekly averages through August 26, while total Federal Reserve assets use the August 26 Wednesday point-in-time observation. The matched ICE BofA spread comparison runs from August 20 through August 27.
The August 28 ETF-flow report measures week-over-week changes in units outstanding following the prior close. It is comparable with the August 21 report, but it does not establish a complete August 21–28 Friday-close split between all equity and all bond ETFs. Different flow universes and reporting windows were not combined. DFR™ therefore remains Unavailable.
Dealer gamma remains modeled and provisional. Public near-close models indicated positive SPX gamma with the index above modeled flip levels, but no directly observable dealer inventory or convention-matched same-model weekly change was available.
Evidence Rule: Observations determine state. Correlated signals are consolidated. Missing evidence is never replaced by price inference.
Executive Summary
The VMSI™ Composite declined to 62.8 from 63.2 as participation weakened further and reserve liquidity became less constructive. Momentum declined to 66.0, SPI fell to 64.2, and Liquidity declined to 57.4. The prior published state had already identified short- and intermediate-horizon participation weakness; this week’s evidence showed that deterioration continuing rather than repairing.
The deterioration occurred beneath rising major-cap prices. The S&P 500 advanced approximately 0.49%, the Nasdaq Composite 0.85%, and the Dow 0.53%, while IWM declined approximately 1.40%. S&P 500 breadth above the 20-day moving average fell another 7.06 percentage points to 42.34%, while 50-day breadth declined 4.88 points to 52.88%.
Conditions improved elsewhere. High-yield OAS tightened 12 basis points, investment-grade OAS tightened 3 basis points, long-duration Treasury prices strengthened, and VIX, VXN, and MOVE declined. The strongest contradiction was that SKEW and put/call ratios increased while ordinary volatility fell.
Observable ETF deployment became less uniformly constructive. IC-VMSI™ declined modestly to 67.2, while ICMI™ edged higher to 55.3 because stronger credit and cross-asset confirmation narrowly outweighed weaker flow and liquidity evidence.
Participation weakened while institutional support rotated from deployment toward credit and duration transmission.
Market Structure
Capitalization-weighted strength separated further from underlying participation.
The S&P 500 gained approximately 0.49%, the Nasdaq Composite 0.85%, and the Dow 0.53%. Small caps moved in the opposite direction, with IWM declining approximately 1.40%.
The breadth term structure deteriorated from the short horizon inward. Approximately 42.34% of S&P 500 constituents finished above their 20-day moving averages, down 7.06 percentage points. The 50-day measure declined 4.88 points to 52.88%, while the 200-day measure eased only 0.74 point to 68.78%.
Friday NYSE breadth finished with approximately 1.77 declining issues for every advancer. S&P 500 new highs nevertheless remained above new lows at 5 to 3. Equal-weight participation also weakened: RSP declined approximately 0.44% while the capitalization-weighted index advanced.
The contradiction remains material. Nearly 69% of constituents remain above their 200-day averages, and new highs still exceed new lows. Participation weakened, but the deterioration did not become a long-horizon structural break.
A deeper market-structure deterioration would require weakness to migrate materially into 200-day breadth, new lows to overtake new highs, and capitalization-weighted trend support to fail.
Price advanced while participation narrowed.
Credit & Liquidity Conditions
Credit repaired while reserve liquidity weakened.
Average reserve balances declined approximately $10.35 billion, from about $2.935 trillion to $2.925 trillion. Total Federal Reserve assets declined approximately $14.79 billion on the separate Wednesday point-in-time convention. The average Treasury General Account declined approximately $2.88 billion, providing a modest offset but considerably less support than the prior week’s Treasury-cash release.
Credit moved in the opposite direction. High-yield OAS tightened from 275 to 263 basis points, while investment-grade OAS tightened from 82 to 79 basis points. The latest weekly tightening accounted for a substantial portion of the one-month improvement, particularly in high yield.
Treasury duration strengthened. TLT advanced approximately 1.01%, extended-duration proxies rose more, and MOVE declined from 73.40 to 70.97. Fixed-income price transmission therefore improved even as central-bank liquidity mechanics became less constructive.
The strongest contradiction was weaker corporate-credit ETF creation/redemption evidence despite tighter underlying spreads.
A renewed fixed-income stress state would require spreads to widen alongside duration weakness and rising rates volatility. That convergence was absent.
Credit repaired as reserve liquidity weakened.
Positioning & Convexity
Surface volatility normalized while asymmetric protection demand increased.
VIX declined from 15.13 to 14.43, VXN from 21.98 to 19.92, and MOVE from 73.40 to 70.97. Ordinary equity, technology, and rates-volatility pricing therefore eased.
Tail-risk behavior moved differently. SKEW increased from 143.90 to 149.77, while the equity put/call ratio rose from approximately 0.51 to 0.62 and the index put/call ratio from 0.85 to 0.99. VVIX edged higher from 86.27 to 86.63.
Public near-close dealer models generally classified SPX positioning as positive gamma, with SPX above modeled flip levels. That evidence supports stabilization only provisionally: dealer inventory is not directly observable, and no consistent same-model weekly transition was established.
The system became quieter at the surface without becoming uniformly less defensive underneath.
This state would be falsified by simultaneous declines in SKEW and put demand alongside sustained low surface volatility and independently stronger dealer stabilization.
Surface volatility eased while tail-risk demand increased.
Flow & Allocation Behavior
Observable capital remained active, but deployment breadth deteriorated.
The same provider’s comparable weekly units-outstanding reports shifted from approximately +$13.9 billion on August 21 to approximately −$15.1 billion on August 28. The current report reflects week-over-week changes following the prior close and therefore does not constitute a complete Friday-close equity-versus-bond flow total.
Allocation remained selective. Technology-sector ETFs received approximately $870 million, concentrated heavily in semiconductor exposure. Government-debt ETFs received approximately $931 million, and metals ETFs approximately $3.4 billion, including about $3.0 billion attributed to GLD. Corporate-debt ETFs, by contrast, experienced approximately $2.4 billion of redemptions.
Large redemptions appeared in several capitalization-weighted wrappers, including IVV and SPY. Those observations cannot be treated as independent proof of withdrawal from the underlying S&P 500 exposure because highly substitutable wrappers can reflect implementation changes, tax effects, or migration between vehicles.
The evidence does not establish broad institutional withdrawal: selected benchmark, semiconductor, government-debt, and metals structures continued attracting capital. It does establish that the prior week’s deployment strength did not persist with the same breadth or clarity.
A renewed deployment expansion would require matched creation/redemption evidence to broaden across benchmark, sector, credit, and international structures.
Capital remained active while deployment breadth narrowed.
Structural Participation Integrity
SPI declined to 64.2 from 66.8.
The locked Breadth Version 2.0 measures showed continued deterioration at the short and intermediate horizons. Twenty-day breadth fell to 42.34%, 50-day breadth to 52.88%, and Friday advancer/decliner breadth reversed negative.
Long-horizon participation remained substantially stronger. Approximately 68.78% of S&P 500 constituents remained above their 200-day averages, while new highs still exceeded new lows.
Equal-weight underperformance and small-cap weakness confirmed the diagnosis contextually, but neither was added to the five-measure breadth architecture.
SPI would deteriorate more decisively if weakness migrated into 200-day breadth and new-low structure. That convergence did not occur.
Participation narrowed without breaking long-horizon structure.
Global Propagation Conditions
Global propagation remained selective and rotated geographically again.
Broader emerging markets held comparatively firm. VWO advanced approximately 0.56% and IEMG approximately 0.31%. China diverged, with FXI declining approximately 0.98%. Japan repaired as EWJ advanced approximately 0.72%, while VEA and EFA each declined approximately 0.5%. ACWI remained slightly positive.
The dollar strengthened from approximately 98.80 to 99.70, reversing the prior week’s favorable currency impulse for international risk assets. Gold declined approximately 3.42%, while WTI crude fell approximately 4.16%.
The strongest contradiction was emerging-market resilience despite the stronger dollar. Global participation remained functional, but developed markets and China did not confirm a synchronized expansion.
A GFP improvement would require emerging and developed markets to strengthen together without depending materially on currency relief.
Global propagation rotated rather than synchronized.
Advanced Signal Layer
The Advanced Framework separated into two opposing states.
SPI declined 2.6 points to 64.2 as participation weakened. GFP and IC-VMSI™ also declined modestly as global synchronization and observable deployment became less uniform.
CMX improved slightly to 60.4 as surface and rates volatility eased, while PDCS increased to 70.2 as tighter credit spreads and stronger Treasury duration preserved transmission capacity.
The system therefore distinguished weaker market organization from more stable fixed-income transmission.
Advanced support shifted from participation and flows toward transmission stability.
CMX — Convexity Metrics Index
CMX increased modestly to 60.4 from 60.0.
VIX, VXN, and MOVE declined, reversing part of the prior week’s broad surface-volatility increase. The improvement was constrained by a different form of protection demand: SKEW rose to 149.77, both put/call measures increased, and VVIX edged higher.
Dealer positioning provided only provisional support because the underlying inventory remains modeled and no clean same-methodology weekly transition was available.
Risk pressure therefore changed form rather than disappearing.
A stronger CMX improvement would require tail-risk and put-demand measures to normalize alongside surface volatility.
Convexity normalized at the surface while asymmetry increased.
PDCS — Pre-Deployment Capital Signals
PDCS increased marginally to 70.2 from 70.0.
Credit supplied the strongest positive evidence. High-yield and investment-grade spreads tightened, Treasury duration strengthened, and rates volatility declined. Those developments preserved the system’s capacity to transmit and absorb capital through fixed-income markets.
The contradiction came from weaker reserve liquidity and less constructive aggregate ETF creation/redemption evidence. Deployment capacity remained available, but actual allocation breadth weakened.
PDCS would decline if credit and duration transmission reversed while liquidity drainage and broad observable outflows continued.
Deployment capacity remained stronger than deployment breadth.
GFP — Global Propagation Framework
GFP declined modestly to 68.6 from 69.0.
Broader emerging markets remained resilient and Japan repaired, but China partially reversed the prior week’s improvement. Developed-market participation remained incomplete, while the dollar’s approximately 0.91% advance created a less supportive currency backdrop.
The strongest contradiction was continued emerging-market resilience despite dollar strength.
The global system remained functional but geographically uneven.
A GFP upgrade would require simultaneous participation across emerging and developed markets rather than continued regional substitution.
Global propagation remained resilient but geographically selective.
PLMT — Post-Linear Market Structure
The PLMT regime remains Selective Synchronization Expansion.
Participation deteriorated, reserve liquidity weakened, and observable ETF deployment became less uniform. At the same time, credit spreads tightened, Treasury duration strengthened, surface volatility declined, major-cap indexes advanced, and long-horizon breadth remained intact.
A defensive transition would require weakening participation to converge with sustained credit deterioration, deeper liquidity stress, broad observable capital withdrawal, and deteriorating cross-asset transmission.
A transition to Broad Participation Expansion would require meaningful short- and intermediate-horizon breadth repair, broader capital-flow confirmation, and stronger developed-market synchronization.
Neither system-level convergence occurred.
Synchronization persisted, but its supporting mechanism rotated.
What information did the system gain this week?
The system learned that the market’s supporting mechanism changed.
August 21 was characterized by stronger observable capital deployment despite weaker participation. During the week ending August 28, participation weakened further and ETF deployment lost breadth, but credit and duration transmission repaired enough to keep institutional migration broadly stable.
The system moved from deployment-led support toward transmission-led support.
Three Hidden-State Discoveries
1. Price strength masked weaker participation and deployment breadth.
Major U.S. capitalization indexes advanced while 20-day and 50-day breadth deteriorated, daily participation turned negative, equal weight underperformed, and small caps declined. Comparable weekly ETF units-outstanding evidence also shifted materially negative.
The strongest contradiction was simultaneous repair in credit spreads and Treasury duration, which prevented the narrowing from becoming a systemic breakdown.
This state would be falsified by sustained breadth repair accompanied by broader matched creation/redemption inflows.
Price strength concealed weaker participation and capital-deployment breadth.
2. Surface calm coexisted with greater tail-risk demand.
VIX, VXN, and MOVE declined while SKEW and both put/call measures increased. The system priced less ordinary volatility while assigning greater weight to asymmetric outcomes.
The contradiction was provisionally positive modeled dealer gamma, which continued to provide some stabilization near the index level.
This discovery would be falsified if skew and put demand normalized while surface volatility remained contained.
3. Institutional support migrated from flows toward transmission repair.
The prior week’s ICMI™ improvement was led principally by ETF Capital Flows.
This week, ETF Capital Flows declined 2.0 points and Liquidity Footprint declined 1.0 point, while Credit Market Confirmation increased 2.5 points and Cross-Asset Confirmation increased 0.8 point. ICMI™ consequently edged higher by only 0.1 point.
The contradiction was continued selective deployment into technology, government-debt, metals, and certain benchmark structures.
This state would lose confirmation if credit spreads widened again while ETF-flow evidence remained weak.
Institutional support shifted from deployment toward transmission repair.
What did VMSI™ discover that price alone did not reveal?
Price showed a major-cap advance.
VMSI™ showed narrower participation, weaker flow and reserve-liquidity evidence, and greater tail-risk asymmetry. It also identified stronger credit and duration transmission beneath that deterioration.
The market did not broaden with price. Its supporting mechanism changed.
Price rose. Participation narrowed. Support rotated.
Earnings Topline
Earnings resilient, divergent.
Major reports including NVIDIA and Intuit exceeded both EPS and revenue forecasts, while company-level surprises and subsequent price responses remained dispersed.
Earnings were not a score-determining input. The validated state was established through participation, liquidity, positioning, credit, flows, and cross-asset transmission.
Institutional Capital Migration Index™
Component
Score
Weekly Change
Trend
Interpretation
ETF Capital Flows
51.5
−2.0
▼
Comparable creation/redemption evidence deteriorated materially, although selective benchmark, semiconductor, metals, and government-debt inflows prevented a broad withdrawal signal.
Dealer Positioning
51.5
0.0
→
SPX dealer models remained broadly stabilizing, but modeled inventory and the absence of a consistent weekly comparison prevented confirmation of improvement.
Liquidity Footprint
50.5
−1.0
▼
Reserve balances and Federal Reserve assets contracted while a modest Treasury-cash decline supplied only a partial offset.
Credit Market Confirmation
64.0
+2.5
▲
High-yield and investment-grade spreads tightened materially and credit-price transmission remained orderly despite corporate-credit ETF redemptions.
Cross-Asset Confirmation
58.8
+0.8
▲
U.S. major-cap equities, Treasury duration, and credit strengthened together while small caps, China, developed markets, commodities, and the stronger dollar limited synchronization.
Institutional Capital Migration Index™ Composite
55.3
+0.1
▲
Credit and cross-asset repair narrowly offset weaker ETF-flow and liquidity confirmation.
Institutional Capital Forensics™
ICMI™ increased marginally to 55.3 from 55.2, while VMSI™ declined to 62.8 from 63.2.
The divergence persisted, but its composition changed.
ETF Capital Flows and Liquidity Footprint weakened. Dealer Positioning remained unchanged. Credit Market Confirmation and Cross-Asset Confirmation supplied the offset.
Institutional support therefore did not strengthen through continuation of the prior week’s broad deployment impulse. It held because tighter credit spreads, stronger Treasury duration, and improved cross-asset transmission compensated for weaker flow and liquidity evidence.
The evidence does not establish broad accumulation. Comparable aggregate ETF creation/redemption activity weakened, exact matched equity-versus-bond totals remain unavailable, and dealer positioning remains modeled.
It also does not establish broad institutional withdrawal. Selected destinations continued attracting capital, credit repaired, duration strengthened, and ICMI™ remained stable.
The state would lose confirmation if weak ETF-flow evidence converged with renewed credit widening, deeper liquidity drainage, and deteriorating cross-asset transmission.
ICMI™ Confirmation: Institutional support held as its source shifted from deployment toward transmission repair.
Final Institutional Assessment
Institutional market conditions weakened modestly during the week ending August 28.
The VMSI™ Composite declined to 62.8 as short- and intermediate-horizon participation deteriorated, reserve liquidity weakened, and observable ETF deployment became less uniform.
The deterioration occurred beneath advancing major-cap prices and did not become systemic. Long-horizon breadth remained intact, credit spreads tightened, Treasury duration strengthened, and surface equity and rates volatility declined. ICMI™ remained broadly stable at 55.3.
The principal structural change was therefore not simply weaker breadth. The system’s support mechanism rotated. Capital-flow and liquidity confirmation weakened, while credit and cross-asset transmission supplied the principal institutional offset.
Current Regime: Selective Synchronization Expansion.
The regime remains appropriate because deterioration has not synchronized across participation, credit, liquidity, capital migration, volatility, and global propagation. Participation remains too weak for a broad-expansion upgrade, while credit repair, duration strength, resilient long-horizon structure, and stable institutional migration prevent a defensive transition.
The regime would lose confirmation if long-horizon breadth, credit, reserve liquidity, and observable capital flows deteriorated concurrently.
That system-level breakdown is not present.
Participation Narrowed. Institutional Support Rotated.
About VMSI™
The VICA Institutional Market Sentiment Index (VMSI™) is an observational market framework designed to measure the institutional conditions shaping market behavior before those conditions become fully reflected in price.
Rather than interpreting indicators independently, VMSI™ measures relationships among participation, liquidity, credit, positioning, capital deployment, and global propagation to identify changes in underlying market organization.
Each weekly publication integrates observable market data, proprietary relationship metrics, and independent structural validation to identify the prevailing institutional market regime.
IC-VMSI™ measures the daily force of institutional core buying across passive and benchmark-linked fund structures, led by Vanguard and BlackRock fund-flow behavior.
The framework estimates institutional capital deployment using observable allocation, creation-and-redemption activity, ownership structures, portfolio positioning, and benchmark-linked investment behavior rather than attempting to identify individual institutional trades.
Disclaimer / Trademark Notice
Disclaimer
VMSI™ is a proprietary observational market framework developed by VICA Research. This publication is provided for informational purposes only and does not constitute investment advice or a recommendation to buy or sell any security.
Conclusions reflect evidence-based interpretations of available market information at the time of publication and may change as new evidence becomes available.
Trademark Notice
VMSI™, IC-VMSI™, ICMI™, Institutional Capital Migration Index™, Institutional Capital Forensics™, and associated framework names are trademarks of VICA Research.
Participation deteriorated across short-, intermediate-, and long-horizon breadth. Volatility conditions improved, while provisional capital-flow evidence supported a stronger—but still selective—deployment...
Reserve liquidity improved materially while participation, rates transmission, and modeled short-horizon positioning weakened. Investment-grade credit remained contained, and observable institutional...
Domestic participation weakened, reserve liquidity became less supportive, and credit spreads widened modestly. International equities strengthened while the dollar declined....