Reserve liquidity improved materially while participation, rates transmission, and modeled short-horizon positioning weakened. Investment-grade credit remained contained, and observable institutional capital deployment continued.
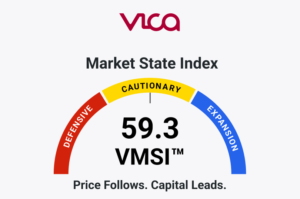
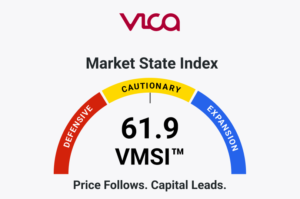
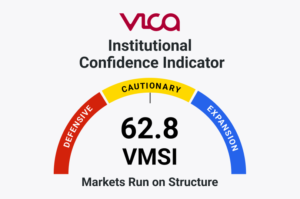
The VMSI™ Composite declined to 59.7, while the Institutional Capital Migration Index™ declined to 54.1.
The institutional system remains in Selective Synchronization Expansion, with materially weaker synchronization.
Participation deteriorated; major-index long-horizon support remains
Liquidity
58.6
+2.7
Reserve conditions improved materially
Volatility & Hedging
57.8
−3.4
Volatility and convexity conditions became less supportive
Safe Haven Demand
50.6
0.0
Defensive allocation remained fragmented
Advanced Framework Layer
Framework
Score
Weekly Change
Institutional State
SPI
58.1
−3.3
Structural participation weakened across breadth horizons
CMX
57.0
−3.4
Convexity and positioning conditions became less supportive
PDCS
68.6
−0.6
Pre-deployment conditions remain constructive, but less supportive
GFP
67.5
−2.9
Global propagation weakened while regional divergence persisted
IC-VMSI™
67.2
0.0
Institutional capital force remained active and selective
PLMT
Selective Synchronization Expansion
No change
Structural regime retained with materially weaker synchronization
Advanced Framework Layer scores are proprietary VICA Research measures. Public reporting presents framework state and directional change; underlying construction methodology remains proprietary.
Signal Integrity
The measurement cutoff is September 11, 2026. September 4 approved scores remain the immutable comparison baseline.
Market-price comparisons use matched September 4 and September 11 closing observations. Displayed five-session performance is not substituted for matched weekly endpoints.
Federal Reserve liquidity uses weekly averages through September 9, with Wednesday point-in-time balance-sheet observations maintained separately. ICE BofA credit spreads retain the matched September 3–10 daily-close convention, with one-month observations used only as context.
Moving-average breadth is matched across weeks. September 11 advancer/decliner and new-high/new-low observations use a current S&P 500 vendor universe that is not fully interchangeable with the prior report’s convention. They therefore describe current state rather than manufactured weekly changes.
ETF datasets retain their native reporting windows and universes. Complete matched weekly equity and bond ETF aggregates remain unavailable; DFR™ remains Unavailable.
Dealer gamma remains MODELED / PROVISIONAL. The matched model represents short-horizon options positioning, not independently observed all-expiry dealer inventory.
Missing evidence reduces confidence where material. It is never converted into negative evidence. Correlated observations strengthen assessment within a domain without creating additional independent confirmation.
Executive Summary
The institutional state weakened through participation and market transmission, not through uniform capital withdrawal.
Small caps and equal-weight equities underperformed capitalization-weighted benchmarks. Breadth deterioration extended through the 200-day horizon, rates volatility increased, and modeled short-horizon dealer positioning became less stabilizing. International equities also lost the broad participation strength that had offset domestic weakness on September 4.
Reserve liquidity moved in the opposite direction.
Average reserve balances increased materially as Treasury cash declined. That improvement strengthened liquidity availability, but it did not coincide with repair in breadth, duration, or lower-quality credit during the measurement window.
Credit remained differentiated rather than systemically impaired. Investment-grade spreads tightened slightly, floating-rate leveraged credit remained comparatively stable, and observable capital continued to deploy across selected equity and fixed-income destinations.
The institutional system weakened around deployed capital; the capital itself did not broadly withdraw.
Market Structure
Capitalization-weighted losses understated deterioration across domestic equity exposures.
The S&P 500 declined 0.80%, the Nasdaq Composite 0.66%, and the Dow 1.57%. IWM declined 2.41%, while equal-weight S&P 500 exposure through RSP declined 1.89%.
Growth was more resilient than value: VUG declined approximately 0.49%, compared with 1.10% for VTV. That represented relative resilience within a declining market, not broad growth-led expansion.
The technical distinction remained important. SPX retained its 50-, 100-, and 200-day averages, while IWM finished below its 50- and 100-day averages. Weakness was therefore more developed outside the largest capitalization exposures.
Friday’s rebound provided meaningful counterevidence but did not reverse the weekly relative-performance deterioration.
Structural Conclusion: Weakness extended beyond headline indexes, with small-cap and equal-weight underperformance confirming a less broadly supported market.
Credit & Liquidity Conditions
Federal Reserve weekly averages showed reserve balances increasing approximately $96.8 billion to $2.991 trillion, while the Treasury General Account declined approximately $84.6 billion to $883.3 billion.
Total reverse repos declined approximately $13.4 billion, but most of that change occurred in foreign-official accounts. The decline therefore should not be characterized as a comparable domestic overnight-reverse-repo liquidity release.
Reserve Bank credit increased only approximately $4.4 billion. Wednesday endpoints corroborated the reserve improvement while total Federal Reserve assets changed only modestly.
The principal liquidity change was therefore reserve availability and liability composition rather than substantial central-bank asset expansion.
Over one month, high-yield spreads were unchanged, investment-grade spreads were only modestly wider, and CCC-and-lower spreads showed the clearest deterioration.
Floating-rate leveraged credit remained comparatively stable, providing counterevidence to generalized financing stress.
Treasury yields increased 26 basis points at two years, 18 at ten years, and 11 at thirty years. The 2s10s slope narrowed 41 → 33 basis points, producing a bear-flattening move.
Structural Conclusion: Reserve conditions improved while rates and lower-quality credit became less supportive; investment-grade and floating-rate credit limited the breadth of impairment.
Positioning & Convexity
The volatility complex finished above September 4 levels despite substantial Friday compression.
VIX increased 14.53 → 15.84, VVIX 84.42 → 91.28, and VXN 20.04 → 21.02. SKEW increased to 154.49.
Rates volatility provided the strongest signal. MOVE increased approximately 12.5% to 82.21.
Options activity also became more index-protection oriented. These volume relationships describe relative activity; they do not identify trade initiators or establish absolute hedge inventories.
The matched short-horizon dealer model changed from positive gamma on September 4 to negative gamma throughout the September 8–11 trading week. The September 11 index close also finished below the model’s zero-gamma level.
The strongest contradiction was Friday’s sharp compression in equity volatility. VIX also remained below VIX3M, limiting the case for immediate equity-volatility dislocation.
Structural Conclusion: Positioning and rates volatility became less stabilizing without establishing acute or uncontrolled volatility stress.
Flow & Allocation Behavior
Observable allocation remained more constructive than the largest individual redemptions suggested.
Matched partial observations showed U.S. and international equity ETF flows improving materially from the comparable prior window, while fixed-income deployment remained positive.
Large opposing movements occurred across highly substitutable benchmark vehicles. Those changes establish wrapper dispersion, not evidence that identical investors transferred identical capital directly between vehicles.
Separate observations showed weaker technology and corporate-credit allocation alongside continued deployment into core bonds, international exposures, and short-government structures.
Bond allocation was also heterogeneous. Short-duration deployment cannot be treated as equivalent to long-duration conviction, and price appreciation cannot substitute for direct flow evidence.
IC-VMSI™ therefore remains 67.2.
Structural Conclusion: Observable capital remained deployed, but its destinations became increasingly selective across wrappers, maturity structures, credit quality, and geography.
Structural Participation Integrity
SPI declined to 58.1, reflecting deeper deterioration across the breadth term structure.
The proportion of S&P 500 constituents above their 20-day averages declined 10.73 percentage points to 24.65%.
Fifty-day breadth declined 8.15 points to 38.76%.
Two-hundred-day breadth declined 7.55 points to 56.46%.
The deterioration at the longest horizon is significant. A majority of constituents remained above their 200-day averages, but that majority narrowed substantially.
The September 11 session provided meaningful counterevidence, with 333 advancers against 163 decliners. Current new highs and lows were 10 and 13, respectively. Under the disclosed vendor conventions, these describe the final session rather than a fully matched weekly transition.
Equal-weight, small-cap, and factor behavior confirm the participation diagnosis but do not create additional breadth inputs.
Structural Conclusion: Friday participation improved, but accumulated deterioration extended materially across short-, intermediate-, and long-horizon breadth.
Global Propagation Conditions
International participation reversed the prior week’s broad improvement.
VEA declined 1.45%, VWO 1.77%, and VXUS 1.44%. EEM, IEMG, and EFA also declined. China’s FXI weakened more sharply at −3.87%.
Japan remained an important exception, with EWJ advancing approximately 0.28%.
The dollar was essentially unchanged, providing little additional directional confirmation. Gold and Treasury duration both weakened, preventing a synchronized conventional haven signal.
The important change from September 4 was the loss of an external participation offset. Stronger international markets no longer counterbalanced weaker domestic structure.
Regional divergence nevertheless remained substantial enough to prevent a generalized global-breakdown assessment.
GFP declined to 67.5.
Structural Conclusion: Global equity participation became less supportive of the domestic system without establishing synchronized global contraction.
Advanced Signal Layer
Proprietary relationship measures reinforced deterioration in participation and short-horizon positioning.
Participation Integrity weakened as equal-weight exposure lagged capitalization-weighted benchmarks.
Hedging Preference became more index-oriented, while Credit Quality relationships softened modestly.
Global Propagation favored developed markets relative to emerging markets, but both weakened in absolute terms.
Deployment Flow confirmation remained unavailable because complete matched weekly aggregates were not available.
These relationships refine the institutional state. They do not independently establish capital accumulation, withdrawal, credit stress, or hedging demand.
Structural Conclusion: Proprietary relationship measures confirmed weaker participation and positioning without establishing broad institutional withdrawal.
CMX — Convexity Metrics Index
CMX declined to 57.0 as higher rates volatility coincided with more defensive relative options activity and less-stabilizing modeled dealer positioning.
Friday’s equity-volatility compression limits the severity of that assessment but does not erase the weekly transition.
Conversely, a negative short-horizon gamma estimate does not establish all-expiry dealer exposure or prove forced selling.
Normalization would require broader improvement across rates volatility, options activity, and positioning rather than another isolated decline in spot equity volatility.
Structural Conclusion: The system became more sensitive to volatility transmission without evidence sufficient to characterize a volatility dislocation.
PDCS — Pre-Deployment Capital Signals
PDCS declined modestly to 68.6.
Improved reserve liquidity offset much of the deterioration in rates, lower-quality credit, and positioning.
The limited score movement does not indicate that little changed. Rather, important forces moved in opposing directions.
Contained investment-grade spreads and continuing observable deployment indicate that capital transmission remained functional, but they do not establish uniformly favorable conditions.
Structural Conclusion: Capital availability remained stronger than the market conditions through which that capital was being transmitted.
GFP — Global Propagation Framework
GFP declined to 67.5 as weaker developed- and emerging-market participation reduced the geographic breadth of support.
The distinction from September 4 is material: international equity strength no longer offset weakening domestic participation.
Japan’s resilience, a broadly stable dollar, and retained longer-horizon structure nevertheless limited the case for generalized global impairment.
International price declines also did not establish international capital withdrawal; observable allocation remained differentiated.
Structural Conclusion: Geographic diversification supplied less participation support without establishing a common global capital-retreat signal.
PLMT — Post-Linear Market Structure
The PLMT regime remains Selective Synchronization Expansion, materially weakened.
Deterioration converged across participation, rates volatility, options positioning, lower-quality credit, and international equity performance.
Countervailing evidence remained substantial.
Reserve availability improved. Investment-grade credit stayed contained. Observable institutional capital remained deployed.
What evidence would falsify the current PLMT regime?
A defensive transition would require continued participation deterioration to converge with broader credit impairment, persistent adverse positioning and global transmission, and verified withdrawal across underlying risk exposures—not merely redemptions in selected vehicles.
Improved reserves would not veto such a transition. A Treasury or gold rally would not be a prerequisite.
A transition toward broad expansion would require sustained breadth repair, wider participation across capitalization tiers, stronger positioning conditions, and broader deployment confirmation.
Neither system-level transition is established by the September 11 evidence.
Weekly observations test implications of PLMT. They do not validate the theory itself.
Structural Conclusion: Selective Synchronization Expansion remains the appropriate regime, but its internal synchronization weakened materially.
What information did the system gain this week?
The location of institutional support changed.
September 4 combined weaker domestic participation with stabilizing modeled positioning and stronger international participation.
Those supports weakened during the September 11 measurement window.
Reserve liquidity improved instead.
This was therefore not simply another week of the same deterioration. Liquidity availability separated more clearly from participation, positioning, and market transmission.
The system gained evidence that improved reserves and weaker market transmission can coexist within the same institutional state.
Three Hidden-State Discoveries
1. Reserve support increased without corresponding participation repair.
Higher reserve balances and lower Treasury cash coincided with weaker breadth, rising yields, and wider lower-quality credit spreads.
Investment-grade resilience and continuing deployment provided the strongest counterevidence to broad impairment.
The differing measurement windows also prevent a causal claim that reserve changes caused—or failed to prevent—the market deterioration.
Structural Conclusion: Improved liquidity offset deterioration; it did not establish structural repair.
2. Core deployment persisted as short-horizon stabilization weakened.
Observable equity and fixed-income deployment remained active while modeled dealer conditions became less stabilizing and relative protection became more index-oriented.
The contrast separates capital presence from the market conditions surrounding its absorption.
Flow coverage remained incomplete, and dealer positioning remains modeled rather than directly observed.
Structural Conclusion: Capital remained present while short-horizon stabilizing conditions deteriorated.
3. Energy strength lacked industrial-commodity confirmation.
WTI increased approximately 9.37% and Brent approximately 8.65%, while copper exposure declined approximately 1.93%.
The divergence distinguishes energy-price pressure from a synchronized commodity advance.
It does not establish a supply shock, demand contraction, or causal explanation for rates.
Structural Conclusion: Oil’s advance was not confirmed by the available industrial-commodity evidence.
What did VMSI™ discover that price alone did not reveal?
Headline index losses did not reveal the improvement in reserve availability or the persistence and composition of institutional capital deployment.
The combined evidence showed weaker participation and stabilization alongside more supportive reserves and continuing allocation.
The deterioration occurred in the conditions surrounding deployed capital—not in verified abandonment of the market system.
Earnings Topline
Earnings resilient. Beats dominate.
Positive earnings surprises were prominent across the weekly reporting sample, while revenue outcomes were less uniform.
Earnings were not score-determining and did not substitute for participation, liquidity, credit, positioning, flows, or cross-asset evidence.
HY and CCC spreads widened; investment-grade and floating-rate credit provided counterevidence
Cross-Asset Confirmation
57.0
−2.5
Weaker
Equity, rates, and credit confirmation deteriorated without uniform defensive synchronization
Institutional Capital Migration Index™ Composite
54.1
−1.2
Moderately weaker
Migration remained mixed, with weaker positioning and transmission partly offset by improved liquidity
The five ICMI™ components retain the locked equal-weight methodology.
The Composite remains within the framework’s mixed or neutral migration state rather than broad institutional distribution.
Institutional Capital Forensics™
Four ICMI™ components weakened while Liquidity Footprint improved.
Dealer Positioning produced the largest negative movement, although its modeled scope remains a material confidence qualification.
Credit and Cross-Asset Confirmation weakened through lower-quality spread deterioration, weaker participation, and less-supportive rates transmission—not because every defensive or financing indicator deteriorated simultaneously.
Flow evidence provided an important constraint. Improved matched partial equity flows and continuing fixed-income deployment prevented large single-vehicle redemptions from establishing generalized withdrawal.
Liquidity supplied the principal positive footprint. Its improvement offset part of the deterioration without changing the evidence in other domains.
ICMI™ Confirmation: Institutional migration weakened within a mixed allocation environment; the available evidence did not establish broad institutional distribution.
Structural Conclusion: The composition of institutional support changed more sharply than the migration Composite alone conveyed.
Final Institutional Assessment
The current institutional state is weaker, but remains functionally supported.
VMSI™ at 59.7 identifies deterioration in participation and market transmission.
IC-VMSI™ at 67.2 records continued selective institutional capital force and deployment.
ICMI™ at 54.1 identifies a modest weakening in capital migration and positioning.
These frameworks measure different dimensions of the institutional system and should not be interpreted interchangeably.
The principal change from September 4 was the location of support.
International participation and modeled stabilization weakened as reserve liquidity recovered. The previous configuration of domestic weakness offset by stronger international participation did not persist.
Improved reserves, contained investment-grade credit, and continuing observable deployment limit the case for a defensive regime transition. None overrides the deterioration elsewhere.
Current Regime: Selective Synchronization Expansion.
The regime would lose confirmation if participation and positioning weakness converged with generalized credit impairment, broader global deterioration, and verified institutional withdrawal across underlying risk exposures.
Conversely, sustained breadth repair, wider capitalization-tier participation, improved positioning, and broader deployment confirmation would strengthen the case for expansion.
Structural Conclusion: Reserve support improved, but the conditions surrounding deployed capital weakened.
About VMSI™
VMSI™ — VICA Market State Index is an observational institutional framework designed to identify changes in the conditions shaping market behavior.
Rather than interpreting indicators independently, VMSI™ evaluates relationships among participation, liquidity, credit, positioning, volatility, capital deployment, and global propagation.
Each weekly publication integrates observable evidence, proprietary relationship measures, and independent structural validation to assess the prevailing institutional market state.
Weekly evidence tests the framework’s implications. It does not prove the theory.
Contradictory evidence defines uncertainty.
Falsification conditions determine when an assessment must change.
IC-VMSI™ Definition
IC-VMSI™ measures institutional core capital-force and deployment behavior through observable allocation, creation-and-redemption activity, ownership structures, portfolio positioning, and benchmark-linked investment behavior.
The framework does not attempt to identify individual institutional trades.
Price, momentum, trading volume, and price-driven AUM appreciation alone do not establish institutional capital deployment.
Underlying model construction remains proprietary to VICA Research.
Disclaimer / Trademark Notice
Disclaimer
VMSI™ is a proprietary observational market framework developed by VICA Research. This publication is provided for informational purposes only and does not constitute investment advice or a recommendation to buy or sell any security.
Conclusions reflect evidence-based interpretations of information available for the stated measurement period and may change as new evidence becomes available.
Trademark Notice
VMSI™, IC-VMSI™, ICMI™, Institutional Capital Migration Index™, Institutional Capital Forensics™, Market Mechanics, PLMT, PIR™, CQR™, HPR™, DFR™, GPR™, and associated framework names are trademarks of VICA Research.
Participation deteriorated across short-, intermediate-, and long-horizon breadth. Volatility conditions improved, while provisional capital-flow evidence supported a stronger—but still selective—deployment...
Domestic participation weakened, reserve liquidity became less supportive, and credit spreads widened modestly. International equities strengthened while the dollar declined....
Major-cap indexes advanced while short- and intermediate-horizon participation weakened and observable ETF deployment lost breadth. Credit spreads tightened, Treasury duration...