VICA Partners | Weekly Institutional Research ·
Week Ending November 13, 2026 | Comparison: November 6, 2026
The VMSI™ Composite rose to 52.9 (+1.2) as participation widened, aggregate volatility pressure eased and reserve liquidity improved, alongside IC-VMSI™ at 64.7 (+0.3) and ICMI™ at 49.7 (+0.8). The recovery did not deliver a corresponding reduction in effective borrowing yields or fully consistent short-dated hedging conditions, leaving the market in Fragile Stabilization rather than synchronized expansion.
VMSI™ Snapshot
Table 1 — VMSI™ Snapshot
Component
Current 11/13
Prior 11/06
Weekly Change
Institutional Interpretation
VMSI™ Composite
52.9
51.7
+1.2
Cautionary; improved participation with incomplete financing confirmation.
Momentum
59.8
56.9
+2.9
Broader short- and intermediate-horizon participation.
Liquidity
53.0
52.1
+0.9
More reserves; funding access not uniformly easier.
Volatility & Hedging
54.1
51.1
+3.0
Broad volatility relief, but shorter-expiry convexity remains adverse.
Safe Haven Demand
52.5
53.0
−0.5
Slight moderation in the defensive-demand assessment.
FIGURE 01 / MARKET STATE
Repair within a cautionary market state
November 13 scores compared with November 6, on a 0–100 index scale.
November 6 November 13
VMSI™ Composite52.9 +1.2
Momentum59.8 +2.9
Liquidity53.0 +0.9
Volatility & Hedging54.1 +3.0
Safe Haven Demand52.5 −0.5
Source: VICA Research approved November 6 and November 13 score ledger. Changes are score points, not percentage returns.
The index remained in Cautionary. Volatility & Hedging (+3.0) and Momentum (+2.9) supplied the largest component advances; Safe Haven Demand eased by 0.5. Together, the component readings are consistent with an improving environment for risk exposure, not independent evidence of new institutional commitments or a lower cost of capital.
Advanced Framework Layer
Table 2 — Advanced Framework Layer
Framework
Current 11/13
Prior 11/06
Weekly Change
Institutional State
SPI™
60.1
57.2
+2.9
Participation broadened, although the late-week impulse faded.
Better deployment conditions, tempered by higher effective financing yields.
GFP™
55.7
54.8
+0.9
Modest, uneven global propagation.
IC-VMSI™
64.7
64.4
+0.3
Constructive implementation without proof of durable ownership.
PLMT™ Regime
Fragile Stabilization
Fragile Stabilization
Unchanged
Recovery constrained by financing and market-structure conditions.
The advanced layer separates participation, convexity, deployment capacity and capital persistence. These variables can move at different speeds. This week, equity and volatility conditions improved faster than the evidence required to establish durable institutional ownership or lower marginal capital costs.
Signal Integrity
Friday-to-Friday prices and breadth compare November 6 with November 13. ICE investment-grade, high-yield and CCC credit measures use their prescribed November 5–12 Thursday windows; Federal Reserve reserve and Treasury General Account balances use November 4–11 weekly averages. Options-market gamma figures are same-provider dated model estimates, not actual dealer-position reports.
The November 12 ETF Action release states that its flow data were observed on November 11; it is not the required five-session endpoint through November 12. The separate ETFIQ November 6–12 fund sample is computed from daily share-count changes and previous-day NAVs, with 2,714 funds representing 57.7% of U.S. ETF assets. The two leveraged semiconductor vehicles discussed below each have five of five daily observations in this window. This partial universe is used for a within-vendor, within-window comparison and is not substituted into the locked ETF Action index. Fund creations and redemptions do not reveal beneficial-owner identity, derivative notional, underlying market transactions or holding intent. Proprietary VICA scores remain the approved readings; confidential calibration and certain ownership, global, safe-haven and market-depth inputs have not been independently replicated.
Executive Summary
The market repaired its willingness to take risk faster than the cost of supplying capital improved. The S&P 500 gained 2.51%, and participation above its 50-day moving average increased 9.82 percentage points. At the same time, VIX fell 6.34 points, and broad modeled SPX gamma became substantially less negative. These are meaningful improvements in participation and immediate risk pricing.
Yet the credit transmission mechanism was less favorable. High-yield spreads narrowed 28 basis points, while the effective high-yield index yield increased 9 basis points. Investment-grade yields rose 25 basis points; CCC yields increased 29 basis points, and CCC-minus-HY spread dispersion widened 22 basis points. Investors accepted less spread compensation for some credit risk, but the total yield demanded by the market did not fall.
Price tolerance and financing discipline also diverged. FactSet found that S&P 500 companies with negative Q3 earnings surprises experienced an average −1.1% share-price response from two trading days before through two trading days after the earnings announcements, versus −3.1% for its five-year reference cohort. That describes more forgiving realized equity pricing during the reporting season, not an improvement in issuer debt pricing or a guarantee that the response will persist. FactSet, November 13.
For capital allocators, the distinction matters. An equity rally may raise collateral values and market confidence, but a higher risk-free curve can still increase refinancing hurdles, impair leveraged transaction economics and pressure long-duration equity valuations. Stronger earnings can offset some of this burden; they do not make financing costs irrelevant. The week’s decisive issue is whether improving risk appetite can be converted into durable investment at the prevailing cost of capital.
Market Structure
The S&P 500 advanced from 7,376.86 to 7,561.67, or +2.51%. The Nasdaq Composite gained approximately 2.27%, the Dow 2.07%, and the Russell 2000 1.32%. Price gains were broad across major benchmarks, though smaller-cap participation in the rally was less convincing than the largest companies’ advance. S&P 500 closing series.
The underlying S&P 500 breadth readings show a stronger intermediate improvement:
Share of S&P 500 constituents trading above their respective moving averages.
November 6 November 13
Above 20-day average66.99% +7.23 pp
Above 50-day average71.37% +9.82 pp
Above 200-day average63.81% +7.84 pp
Matched S&P 500 breadth observations. Changes are percentage points; horizons overlap and do not constitute independent asset-allocation flows.
The 20-day reading peaked at 72.56% on November 11, then declined to 66.99% by Friday. That does not negate the weekly improvement; it establishes that the recovery lost some near-term participation before the week ended. The 50- and 200-day expansions are more encouraging evidence of market repair than a single index close. But breadth measures how many constituents participate, not how long their owners will hold the resulting exposure.
The market therefore entered the following week with a stronger participation base but a still-unresolved test of persistence. For institutional accounts, the next question is whether equal-weight, smaller-cap and sector participation can sustain their advance as funding benchmarks rise.
Credit & Liquidity Conditions
Credit spreads tightened during the prescribed November 5–12 window: IG 93 → 89 basis points (−4); HY 348 → 320 (−28); and CCC-and-lower 1,320 → 1,314 (−6). The smallest improvement occurred in the weakest credit tier. Consequently, the spread between CCC and the broader high-yield index widened from 972 to 994 basis points, an additional 22 basis points of lower-quality dispersion. ICE/FRED IG · HY · CCC.
Spread compression did not mean cheaper borrowing. Over the same dates, effective index yields rose 25 basis points for IG (5.71% → 5.96%), 9 basis points for HY (8.07% → 8.16%), and 29 basis points for CCC (17.69% → 17.98%). The benchmark backdrop was consistent with that pressure: the U.S. 10-year Treasury par yield increased 29 basis points, from 4.86% on November 6 to 5.15% on November 13. IG effective yield · HY effective yield · CCC effective yield · Treasury yield curve.
FIGURE 03 / FINANCING TRANSMISSION
Spreads narrowed. Effective yields rose.
Matched Thursday-to-Thursday change, November 5–12, in basis points.
Credit tierRisk spreadEffective yield
Investment grade−4 bpOAS+25 bpYield
High yield−28 bpOAS+9 bpYield
CCC and lower−6 bpOAS+29 bpYield
Source: ICE BofA index OAS and effective yields via FRED. The display compares separately constructed index measures, not comparable new-issue quotes or a pure rate/spread decomposition.
The underwriting distinction is between lower credit-risk compensation and cheaper funding. The matched effective-yield changes minus matched OAS changes were +29 basis points for IG, +37 for HY, and +35 for CCC. This yield-minus-spread translation gap is a transparent cross-series diagnostic, not a measured change in the underlying risk-free curve: credit-index effective yields and option-adjusted spreads incorporate duration, option and composition differences. It establishes that the reported spread relief did not translate into falling index effective yields.
For an illustrative $1 billion debt refinancing, a 9-basis-point higher annual borrowing rate corresponds to $0.90 million of additional annual interest expense before fees and covenant changes. This is a linear sensitivity applied to the observed HY index-yield change—not a report of any issuer’s new-issue pricing, a projection of default, or a measured industry refinancing bill.
Decision test: match the same issuer, maturity, seniority, call protection and currency against actually executable refinancing terms. Distinguish fixed coupons that have not reset, floating-rate liabilities that reprice sooner, and debt maturing into the current curve.
Federal Reserve weekly-average reserve balances rose $30.515 billion, from $2,930.088 billion to $2,960.603 billion. The Treasury General Account declined $42.805 billion, from $957.175 billion to $914.370 billion. Federal Reserve H.4.1, November 12 release.
FIGURE 04 / RESERVE LIQUIDITY
Reserve balances recovered as TGA declined
Weekly-average balance changes, November 4–11, U.S. dollars in billions.
Treasury General Account−$42.805B$957.175B → $914.370B
Source: Federal Reserve H.4.1, weekly averages; related balance-sheet channels, not two independent confirmations of private financing availability.
Reserve availability expanded, but the private financing transmission has more steps than a reserve balance. Bank balance-sheet limits, dealer intermediation, regulatory capital, collateral haircuts and investor risk budgets can prevent additional reserves from lowering marginal credit costs. The week therefore delivered more system reserves alongside higher observed market yields. A durable expansion case requires both improved funding availability and actual refinancing terms that can clear borrowers’ cash-flow hurdles.
Positioning & Convexity
VIX declined from 25.64 to 19.30, a substantial easing in near-term equity volatility pricing. The reported VIX/VIX3M ratio fell from 1.042 to 0.936, while VVIX declined from approximately 121.9 to 101.5. The volatility complex became less stressed, but a lower implied-volatility level should not be mistaken for evidence of uniformly stabilizing derivatives positioning.
Same-provider modeled SPX gamma became less negative across all expirations, improving from approximately −$85.8 billion to −$54.2 billion per 1% index move. In contrast, the rolling seven-day estimate deteriorated from −$22.7 billion to −$35.0 billion. These are modeled sensitivities under the provider’s assumptions; the seven-day contract universe also changed between the observation dates. I Love Vol, November 6 · November 13.
Same-vendor modeled SPX gamma, USD billions per 1% index move.
All expirations−85.8 → −54.2Less negative by $31.6B
Rolling seven-day window−22.7 → −35.0More negative by $12.3B
Source: I Love Vol dated November 6 and November 13 model scoreboards. Rolling expiry composition changes; modeled sensitivities are not observed dealer inventories.
The closing-day reversal is the essential caveat: the same vendor’s all-expiration SPX model fell from approximately −$14.3 billion on November 12 to −$54.2 billion on November 13, even though the November 6-to-13 comparison still improved by $31.6 billion. This is a dated modeled sensitivity change, not direct evidence that dealers sold $39.9 billion of futures or changed their net inventory. The short-horizon implementation question is whether a comparable sell order encounters materially different depth, spreads or impact below the model’s gamma-flip region. November 13 vendor review.
For execution desks, risk budgeting and order staging should therefore distinguish the direction of the weekly volatility regime from the potential price sensitivity of the next trading session. The model does not supply an executable trade-size threshold; a fixed-contract revaluation and independent transaction-cost data would be required to advance that claim.
Flow & Allocation Behavior
A separately identified ETFIQ five-session fund sample recorded approximately $26.3 billion in net ETF flows from November 6 through November 12 across 2,714 funds, representing approximately 57.7% of covered U.S. ETF assets. QQQ added $11.1 billion, or 42.2% of the sample’s net total; this share uses a net denominator that can be magnified by offsetting redemptions and must not be presented as a share of gross subscriptions or the whole ETF market.
Counterevidence matters: the same five-day sample showed SPY +$4.1 billion, QQQM +$2.1 billion and equal-weight RSP +$1.4 billion. Implementation was concentrated in prominent growth and benchmark vehicles, but not exclusively in QQQ or one capitalization exposure. Only 839 of the 2,714 sampled funds (30.9%) registered net inflows in the window: positive aggregate dollars should not be described as uniformly distributed fund subscriptions. Zero-flow and net-redemption funds are distinct, and a fund-count measure is not weighted by assets. Source: ETFIQ, data through November 12.
Two-sided tactical deleveraging is the more discriminating comparison. In that same fund-level window, the daily-reset three-times-long semiconductor ETF SOXL recorded approximately −$3.7 billion in net creations/redemptions (about −27.0% of its starting net assets), while the opposing three-times-inverse semiconductor ETF SOXS recorded approximately −$2.7 billion (about −49.4% of starting assets). Both had five complete daily readings. Their combined $6.4 billion in redemptions is a sum across two opposing fund vehicles, not a measured reduction of $6.4 billion in net semiconductor ownership or marketwide leverage. Moreover, ETFIQ reported SOXL +$3.7 billion on November 5 immediately before the subsequent five-session −$3.7 billion fund flow—an observed reversal of net share creation, not evidence of a common investor reversing a position. Source: matched ETFIQ weekly fund records.
Redemptions in both opposing leveraged products are consistent with some tactical exposure being reduced or rotated, but mechanical resets, creations by authorized participants, hedges, and replacement vehicles remain competing explanations. A benchmark rebalance, temporary inventory, portfolio substitution or long-horizon allocation can also produce creation totals elsewhere. These records establish fund implementation, not beneficial-owner conviction or a directional semiconductor trade.
The resulting research question is sharper than whether ETF inflows were positive: Did broad stock-level participation translate into broadly distributed, persistent ownership? The matched 50-day breadth reading increased 9.82 percentage points even as QQQ alone accounted for a large share of the sampled net ETF issuance. Those different universes are not causally linked; a fixed-fund, fixed-security panel combined with issuer-level subscriptions and investor persistence is the required bridge.
Structural Participation Integrity
SPI™ advanced to 60.1, up 2.9 points. Improvements in all three established S&P 500 moving-average breadth measures support a real participation repair rather than an advance confined to a handful of capitalization leaders.
But there is a consequential distinction between participating in a rally and absorbing supply under stress. Breadth measures the former. The latter requires observations of market depth, execution costs, turnover resilience and price impact during comparable order flows. The late-week decline in 20-day breadth makes this a relevant forward test rather than an abstract qualification.
Capital allocation should treat improved participation as greater opportunity breadth, not as automatic evidence that market capacity has become structurally deeper.
Global Propagation Conditions
GFP™ improved modestly to 55.7 (+0.9). The advance indicates a cautiously better global transmission assessment, not synchronized international expansion.
Regional equities can respond differently to dollar movements, commodity exposure, industrial composition and local financing conditions. A U.S.-listed international ETF’s dollar return also combines underlying local-market performance and exchange-rate translation. Consequently, apparent global agreement can be produced by a common currency factor rather than parallel domestic capital deployment.
The relevant standard is aligned market, currency and flow evidence across regions. The available matched global dataset does not warrant describing a sustained, globally synchronized institutional allocation cycle.
Advanced Signal Layer
VICA’s PIR™, CQR™, HPR™, DFR™ and GPR™ relationships remain part of the standing structural toolkit. Their approved definitions are unchanged; no new numerical readings are introduced without the corresponding matched inputs and calculation record.
Three independently useful comparisons illuminate this week’s state: participation widened, credit spreads tightened while effective yields rose, and aggregate modeled gamma improved while short-expiry gamma deteriorated. These are not three votes for the same conclusion. They identify different transmission channels with different horizons and sources of measurement risk.
The institutional value of the advanced layer lies in retaining these differences until additional evidence resolves them—not compressing them into a single narrative of uniform recovery.
Convexity / Market Structure — CMX™
CMX™ rose to 52.9 (+2.8). Broad gamma conditions improved materially, complementing the decline in VIX. But the adverse seven-day reading changes the practical interpretation: a more favorable aggregate environment may still contain unstable short-horizon zones.
Risk management should therefore distinguish overall volatility exposure from expiration-sensitive liquidity demand. Where a portfolio’s financing or hedging arrangements require near-term rebalancing, the distribution of conditional exposure across expirations can be as important as the aggregate level.
The next confirmation test is a fixed-expiration, fixed-input comparison supplemented by independent execution evidence. Until then, the measure describes modeled sensitivity rather than dealer ownership.
Primary Deployment & Capital Structure — PDCS™
PDCS™ improved to 61.6 (+0.9). Reserve availability and credit-risk spread compression were constructive, but the offsetting increase in effective yields alters the price at which new projects, acquisitions and refinancing transactions must clear.
This matters most when the marginal transaction is financing-constrained rather than demand-constrained. A portfolio manager may view improving equity breadth as an opportunity to add exposure; a project sponsor confronting a higher fixed funding rate may simultaneously defer a capital commitment. Both decisions can be rational responses to the same week.
The distinction identifies a specific risk to the recovery: market enthusiasm can strengthen before the economics of deploying levered capital become more attractive. Subsequent new-issue execution, borrowing terms and sustained subscriptions offer better confirmation than flows alone.
Global Financial Propagation — GFP™
GFP™ increased to 55.7 (+0.9), a modest improvement within a still-uneven cross-border setting. The important mechanism is whether stronger U.S. participation transmits through common funding markets into sustained international exposure.
A higher U.S. yield structure can simultaneously support dollar-denominated income opportunities and raise funding or translation pressure elsewhere. Regional performance therefore needs to be separated into local price, currency translation and actual capital movement before claiming a shared global regime.
The week’s global assessment is constructive but selective; it does not supply independent proof of synchronized institutional allocation.
Post-Linear Market Theory — PLMT™
PLMT™ remains in Fragile Stabilization. The regime is consistent with a market where prices and immediate risk measures improve faster than the underlying financing, ownership and execution constraints that determine how much risk institutions can maintain.
Benchmarks, mandates, risk budgets, financing obligations and liquidity requirements create inertia. That inertia can make a market rally self-reinforcing for a period without ensuring that its current path can be maintained. Conversely, a higher risk-free rate can limit future transaction formation even when investors demand less incremental compensation for risky credit.
The theory does not specify a unique price path. It proposes that capital constraints create recurring, measurable structural tendencies despite variable paths. A transition toward Expansion would require broader evidence of sustained participation, lower effective financing pressure, resilient short-expiry hedging and persistent capital ownership—not merely a higher index level.
What Information the System Gained
The week delivered three information gains relevant to underwriting:
Financing transmission: The 28-basis-point high-yield spread tightening coexisted with a 9-basis-point effective-yield increase. Their 37-basis-point yield-minus-spread change is a directly reproducible cross-series diagnostic—not an isolated Treasury contribution. It changes the question from whether credit risk was repriced to whether issuers could refinance on better all-in terms.
Expiration sensitivity: The all-expiration modeled gamma estimate improved $31.6 billion across the week but deteriorated $39.9 billion from Thursday to Friday; the changing seven-day contract universe was more adverse on a weekly comparison. The institutional implication is to evaluate implementation risk over the actual trading horizon, not only the week’s average direction.
Participation versus implementation: Fifty-day S&P 500 breadth widened 9.82 percentage points, while just 839 of 2,714 ETFIQ funds (30.9%) registered positive five-session net flows. QQQ supplied $11.1 billion of the sample’s $26.3 billion net; equal-weight RSP also attracted $1.4 billion. More distinctively, a five-day-complete pair of opposing semiconductor leveraged funds, SOXL and SOXS, both recorded redemptions, and SOXL reversed the sign of its immediately preceding day’s net share formation. The index-constituent, fund-count and fund-dollar universes are different: their contrast is a question for institutional research, not proof of a common investor rotation or a causal link.
None of these findings, alone, establishes a proprietary forecasting advantage. Together they define a more discriminating institutional market state than price direction alone.
Three Hidden-State Discoveries
Discovery 1 — Risk-Premium Repair Without Funding-Cost Relief
Observation. In the authorized Thursday window, HY OAS declined 28 basis points, effective HY yield rose 9 basis points, and CCC-minus-HY OAS dispersion widened 22 basis points. The simple effective-yield minus spread-change diagnostic was +37 basis points for HY, versus +29 for IG and +35 for CCC.
Mechanism and competing explanation. A tighter credit-risk premium can coexist with a higher financing hurdle if the rate environment moves more than the premium declines. The cross-series arithmetic does not isolate the Treasury contribution, because effective yields, option adjustments and index weights are not a fixed-bond experiment. It also says nothing by itself about whether a particular issuer can access refinancing.
Confirmation / falsification. For each target issuer, compare executable debt terms at matched seniority, maturity, call structure and cash-flow profile against the previous week. A broadly lower fixed-issuer refinance coupon would weaken the higher-funding-hurdle hypothesis; expensive or unavailable issuance despite tighter index OAS would strengthen it. Freeze the selection before observing outcomes.
Capital consequence. Distinguish the immediate cash flow of floating-rate borrowers, the future reset exposure of fixed-rate borrowers, and the discount-rate sensitivity of long-duration equity. The reported index shift does not justify an automatic credit downgrade or trade recommendation.
Discovery 2 — A Calmer Volatility Market with Localized Convexity Risk
Observation. VIX fell 6.34 points over the week, and all-expiration modeled gamma improved by $31.6 billion per modeled 1% index move, yet the modeled all-expiration reading became $39.9 billion more negative from Thursday to Friday. On a rolling seven-day weekly comparison the modeled reading deteriorated $12.3 billion.
Mechanism and competing explanation. The distribution of near-expiry convexity may create conditional local sensitivity inside a broader recovery. However, spot, implied volatility, strike composition and the roll of the November 20 monthly expiration into the seven-day window can produce much of the contrast without an actual dealer inventory change.
Confirmation or falsification: Revalue a constant expiration-and-strike universe with matched assumptions and test realized price impact around comparable order flows. Disappearance of the discrepancy under those controls would narrow or overturn the proposed transmission claim.
Capital consequence: Short-horizon execution risk should be assessed separately from the headline VIX reading.
Measured observation. S&P 500 50-day breadth rose 9.82 percentage points, but only 839 of 2,714 funds (30.9%) in ETFIQ’s separately sampled November 6–12 panel registered net inflows. Within the panel, QQQ +$11.1 billion and RSP +$1.4 billion coexisted with SOXL −$3.7 billion and SOXS −$2.7 billion. The latter are opposing daily-reset semiconductor leveraged products with complete five-of-five-day flow observations. SOXL had recorded +$3.7 billion on the prior November 5 session, a useful separately dated sign-reversal comparison. ETFIQ five-session source · November 5 daily source.
Proposed mechanism and competing explanations. Stock-level breadth can rise even as net new ETF share formation is concentrated in fewer vehicles. Simultaneous redemptions in bullish and bearish leveraged semiconductor funds are consistent with a two-sided reduction in tactical fund exposure, not a simple directional vote on the industry. Creation/redemption mechanics, daily resets, rebalancing, offsetting flows into other instruments, and changes in the reporting universe may offer alternative explanations. These observations neither identify the same ultimate holders nor measure net sector leverage.
Independent confirmation and falsification. Freeze this two-fund panel (SOXL, SOXS) and benchmark funds (QQQ, SPY, RSP) before observing later five-session windows; retain exact daily shares, prior NAV, adjusted asset bases and missing-data flags. If the same funds show rapid net creations in both leverage directions after the observed redemptions, the temporary tactical-unwind explanation strengthens; if fund-share revisions or reporting differences erase the two-sided redemptions, it fails. Ultimate-owner persistence requires a separate investor-level record and cannot be inferred from either outcome.
Capital-allocation consequence. Underwrite the breadth of securities participating, the concentration of fund issuance, and the two-sided turnover of leveraged implementation vehicles as three different conditions. Do not infer net institutional semiconductor exposure, sector conviction or market capacity from the $6.4 billion sum of opposing leveraged redemptions.
What VMSI™ Discovered That Price Alone Did Not
The S&P 500’s +2.51% return establishes that equity prices rose. It does not reveal whether financing became cheaper, whether short-dated modeled hedging sensitivity improved, whether participation broadened across constituents or whether creations represent long-term institutional ownership.
This week’s market-state evidence answers some of those questions differently. Breadth improved broadly; effective borrowing yields increased; expiration-conditioned convexity remained uneven. Those distinctions change the inference an allocator might draw from the same positive equity return.
The central information gain is not a claim that VMSI™ foresaw the rally. It is a clearer picture of the constraints that may determine whether the rally is converted into lasting risk deployment.
Earnings & Topline Conditions
Earnings offered an important counterweight to the financing story. FactSet’s November 13 Earnings Insight reported that 91% of S&P 500 companies had reported third-quarter results. Blended year-over-year earnings growth reached 31.9%, compared with 31.4% in the prior dated publication, and 84% of reporting companies exceeded EPS estimates. Revenue estimates were exceeded by 74% of reporters. FactSet Earnings Insight, November 13.
Aggregate EPS surprise was approximately 3.1%, up from 2.7% in the previous dated FactSet release but below the 7.5% five-year full-season average. The forward 12-month P/E increased from 17.7 on the prior publication to 18.3. Critically, 18.3 remained below both FactSet’s five-year 19.8 and ten-year 19.1 averages; calling the current multiple historically excessive on this comparison would be misleading. The multiple nevertheless rose into an upward-moving Treasury yield environment, increasing the importance of future cash-flow duration and estimate resilience. Prior FactSet release · November 13 Earnings Insight.
An unusually asymmetric earnings reaction deserves separate attention. FactSet reported average stock returns of +1.1% for positive Q3 EPS surprises versus a five-year +0.9% reference, and −1.1% for negative surprises versus a five-year −3.1% reference, measured from two trading days before through two days after each announcement. That 2.0-percentage-point smaller miss penalty is evidence of more forgiving pricing during the sample—not a new VMSI input or independent confirmation of capital ownership. FactSet also found a −7.8% average response among just three large technology leaders with negative surprises, so the favorable broad-sample tolerance must not be generalized to every concentration-sensitive equity. FactSet event study.
Reporting-company coverage rose from 88% to 91%, so the change in blended earnings growth is not an equal-company panel estimate. At the same time, 45 of 78 companies issuing fourth-quarter EPS guidance were positive, and FactSet’s bottom-up fourth-quarter EPS estimate had increased 1.1% since September 30—a cumulative revision, not a weekly change. The institutional test is whether more forgiving equity reactions and resilient near-term earnings can persist if issuer financing costs remain high; the reporting-season study and credit-index window are different samples and do not establish causation.
Institutional Capital Migration Index™ — ICMI™
Table 3 — Institutional Capital Migration Index™
Component
Current 11/13
Prior 11/06
Weekly Change
Institutional Interpretation
ETF Capital Flows
59.9
59.4
+0.5
Constructive implementation assessment; ownership duration not directly observed.
Dealer Positioning
46.5
45.5
+1.0
Improved modeled conditions, still defensive.
Liquidity Footprint
50.1
49.1
+1.0
Reserve support, with incomplete private-financing confirmation.
Credit Market Confirmation
46.9
45.7
+1.2
Tighter spreads alongside higher yields and wider lowest-tier dispersion.
Cross-Asset Confirmation
45.2
44.7
+0.5
Modest improvement without broad synchronization.
ICMI™ Composite
49.7
48.9
+0.8
Defensive Capital Migration.
The five components carry equal 20% weights; their displayed mean is 49.72, reported as 49.7. The index remains in Defensive Capital Migration even as several conditions improve. That is a substantive distinction: implementation and market repair are not equivalent to a proven shift into lasting institutional accumulation.
Table 4 — New Research | 20D™ Experimental Forward Market Assessment
Condition: Estimate must be frozen before its first eligible reference close.
Source: VICA Research owner-approved experimental analyst outlook, +1.50%. Price return excluding dividends. No validated statistical-model output. The forecast is not counted as prospectively issued until its actual timestamp and eligible anchor are recorded; dates move if the planned window is missed.
The positive estimate reflects a selectively constructive market state, not a declaration that a sustained expansion has begun. Its magnitude is an analyst judgment rather than the numerical output of a frozen, prospectively validated forecasting model. The earlier +2.20% November 6 illustration was calculated retrospectively on November 12 and must not be treated as a prior live forecast; historical testing has not demonstrated robust incremental predictive superiority. VICA cumulative validation record.
Prospective control. The +1.50% figure is an owner-approved, non-binding analyst estimate, not a frozen statistical-model output. An actual publication timestamp, forecast fingerprint, data cutoff, unchanged numeric value and first eligible SPX reference close must be archived before it can enter the prospective evaluation record. November 16 close and December 15 close remain planned dates, not retroactively asserted issuance events; if the forecast is not locked before the first eligible close, the reference and maturity dates move forward. Errors, unsuccessful results and contradictory benchmarks will be retained in the append-only validation record.
Institutional Capital Forensics™
IC-VMSI™ reached 64.7 (+0.3), a selective improvement in institutional deployment conditions. The six dimensions should not be compressed into a single proxy for ETF subscriptions.
Ownership Stability asks who ultimately owns the exposure and for how long. Passive Demand evaluates benchmark-linked implementation without assuming every creation is a lasting allocation. Active Manager Demand concerns independently observable active decisions. Flow Momentum captures the direction and persistence of measured subscriptions. Market Absorption concerns execution depth and price impact. Institutional Conviction requires evidence that allocations withstand changing conditions.
The research sequence remains Alert → Absorption → Persistence → Confirmation. The current record is strongest on observable implementation, weaker on durable owner identification and comparable execution data. That imbalance is analytically useful: it identifies exactly where apparent market strength still requires confirmation.
Final Institutional Assessment
Participation recovered; financing conditions did not deliver equivalent relief. The approved composite readings—VMSI™ 52.9, IC-VMSI™ 64.7, and ICMI™ 49.7—describe improving market mechanics within Fragile Stabilization and Defensive Capital Migration.
The capital-allocation implication is selective, financing-aware underwriting, not an indiscriminate change in equity exposure. Rising effective yields change the hurdle for leveraged issuers and deferred projects; broadening participation increases the range of securities supporting the recovery; near-expiry model sensitivity can alter implementation costs without identifying actual dealer trades. The flow record also distinguishes positive net ETF issuance from widespread fund-level accumulation: only 30.9% of the sampled funds had positive net flows, while opposing long and inverse semiconductor leverage funds both redeemed shares. Better earnings provide an important offset, while the forward P/E remains below its five- and ten-year averages on the cited FactSet measure.
THE THREE UNDERWRITING TESTS
01 / Financing
Can the issuer refinance or fund a project at an all-in cost consistent with sustainable cash-flow coverage?
02 / Execution
Does the actual order meet depth, spread and slippage constraints under comparable near-expiry conditions?
03 / Persistence
Do observed creations correspond to maintained exposures after price and volatility normalize?
These are research tests, not new index thresholds or trade instructions.
Three developments would strengthen the expansion case: persistent intermediate breadth, actual relief in all-in financing terms across credit quality tiers, and capital-flow confirmation beyond concentrated creations. A reversal of breadth, increasing lower-tier financing stress or demonstrably deteriorating execution liquidity would weaken the stabilization case.
The allocation question is not whether prices rebounded. It is whether the next dollar of institutional capital can be financed, deployed and maintained under the prevailing constraints.
About VMSI™
VMSI™ is VICA Research’s proprietary observational framework for institutional market conditions, integrating participation, liquidity, credit, volatility, positioning and allocation behavior. It distinguishes price movement from the capital mechanisms that may sustain or constrain it. The composite is not a simple arithmetic average of its displayed subcomponents and is not itself a return forecast.
Price follows. Capital leads.
Scientific Standard
This research separates observed market prices and balances, vendor-modeled derivatives sensitivity, and hypotheses about institutional behavior. The historical index scores are proprietary, and confidential score transformations are not claimed to have been independently reconstructed. Source windows are dated, distinct measurement universes are not silently combined, and counterevidence is not discarded. The experimental 20D™ analyst outlook has not demonstrated prospective forecasting superiority. The permanent VICA Scientific Validation Record preserves historical results and adverse findings.
IC-VMSI™ Definition
IC-VMSI™ — Institutional Capital VMSI — assesses ownership stability, passive and active demand, flow momentum, market absorption and institutional conviction. Implementation flows are useful evidence of activity, but neither fund creations nor rising prices alone identify ultimate institutional owners, holding duration or durable capital commitment.
Disclaimer / Trademarks
Disclaimer: This research is for informational purposes and does not constitute individualized investment advice, a security recommendation or a solicitation. Index readings reflect proprietary research judgments; measured market observations, statistical experiments and vendor-modeled derivatives exposure involve differing uncertainties. Historical findings and retrospective error reductions do not establish future returns, and the experimental 20D™ analyst outlook is non-binding and unvalidated as a statistical-model prediction.
VMSI™, IC-VMSI™, ICMI™, Institutional Capital Migration Index™, Institutional Capital Forensics™, Market Mechanics, PLMT™, SPI™, CMX™, PDCS™, GFP™, PIR™, CQR™, HPR™, DFR™ and GPR™ are VICA Research proprietary framework names or marks.
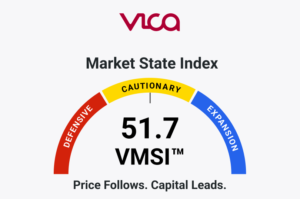
ScoresFrameworksDiscoveriesICMIAssessment The VMSI™ Composite declined to 51.7 (−1.4), while IC-VMSI™ increased to 64.4 (+0.4) and ICMI™ eased to 48.9 (−0.2),...
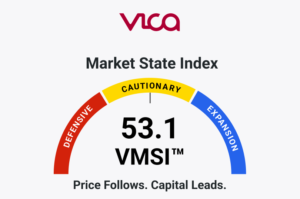
ScoresFrameworksDiscoveriesICMIAssessment The VMSI™ Composite declined to 53.1, with IC-VMSI™ at 64.0 and ICMI™ at 49.1, as recovering ETF issuance and...
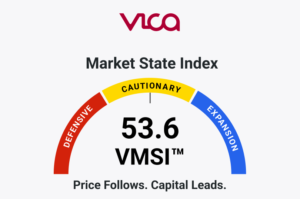
ScoresFrameworksDiscoveriesICMIAssessment The VMSI™ Composite declined to 53.6, with IC-VMSI™ at 63.0 and ICMI™ at 48.7, as broader equity participation and...