VMSI™ | October 23, 2026 — Participation Strengthened. Capital Confirmation Weakened.
October 26, 2026
Matthew Krumholz
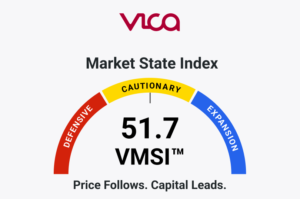
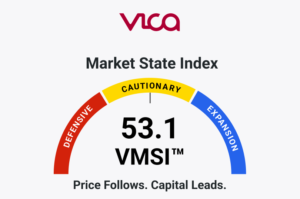
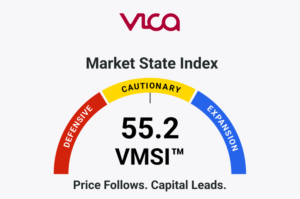
The VMSI™ Composite declined to 53.6, with IC-VMSI™ at 63.0 and ICMI™ at 48.7, as broader equity participation and Treasury-duration strength coexisted with wider credit spreads, lower reserve balances and slower positive ETF issuance. Fragile Stabilization remains VICA’s PLMT™ regime assessment, while ICMI™ entered Defensive Capital Migration, reflecting stronger domestic participation without comparable confirmation from credit, capital deployment and global markets.
VMSI™ Snapshot
Component
Current
Prior
△ (w/w)
Interpretation
Composite
53.6
55.2
▼ −1.6
Cautionary: improving participation offset by weaker credit, liquidity and capital-deployment confirmation.
Partial volatility relief; elevated Nasdaq and Treasury volatility and negative modeled gamma constrain improvement.
Safe Haven Demand
52.0
51.6
▲ +0.4
Treasury-duration strength supported by falling yields; gold weakness and incomplete allocation evidence limit broader defensive confirmation.
Week Ending October 23, 2026 · Represents the most recently completed reporting week.
Advanced Framework Layer
Advanced Framework Layer scores are proprietary VICA Research measures. Public reporting presents framework state and directional change; underlying construction methodology remains proprietary.
Framework
Score / State
Weekly Change
Institutional State
SPI™
59.2
+2.1
S&P constituent participation improved across 20/50/200-day horizons; independent capital confirmation incomplete.
CMX™
53.9
+0.4
Some implied-volatility relief, but modeled negative-gamma convexity sensitivity persists.
PDCS™
58.3
−3.6
ETF creations decelerated materially; reserve liquidity and credit confirmation weakened.
GFP™
57.6
−1.4
Uneven international and emerging-market propagation; global risk appetite not uniformly confirmed.
IC-VMSI™
63.0
−2.2
Selective capital-force evidence softened; direct manager ownership and order-book absorption remain incomplete.
PLMT™
Fragile Stabilization
Unchanged
Same regime, weakened by credit/liquidity/deployment divergence despite breadth repair.
Structural Conclusion: Participation strengthened, but credit, liquidity and deployment conditions provided weaker confirmation of durable institutional expansion.
Signal Integrity
The measurement cutoff is October 23, 2026, with October 16 providing the immutable historical-score comparison. Market-price changes use matched Friday closes and exclude distributions. The established S&P 500 constituent series supplies the 20-, 50- and 200-day breadth comparisons.
The underlying evidence retains separate observation windows. Corporate-credit OAS uses ICE BofA observations dated October 15 and October 22, distributed through FRED. ETF Action’s October 16 and October 23 reports use rolling five-session issuance totals ending on those Thursdays, under its T+1 reporting convention. ETF Channel category observations use the week-over-week columns in its separately dated October 16 and October 23 publications. Their fund universes are not interchangeable.
Federal Reserve liquidity uses H.4.1 weekly averages ending October 14 and October 21, released October 15 and October 22. Weekly averages are not combined with Wednesday point-in-time balances. Treasury nominal and inflation-indexed par yields use matched Treasury observations. The nominal-minus-real differential approximates inflation compensation but does not isolate term premium, liquidity effects or expected inflation.
The research record preserves the source, observation date, reporting convention and calculation basis for each comparison. ETF price returns are calculated from matched closes; they are not evidence of net subscriptions. ICE BofA credit spreads are related measures within overlapping borrower universes, not independent confirmations simply because multiple ratings are observed.
The FactSet October 16 and October 23 publications differ in their retrospective description of the preceding week’s third-quarter blended earnings-growth estimate. The report therefore uses each publication’s directly dated figures and does not manufacture a precise weekly third-quarter revision from that inconsistency.
Complete matched constituent advance/decline and new-high/new-low records remain unavailable in the transferred research. Dealer gamma is modeled, with no complete matched numerical net-GEX comparison. Direct active-manager allocation, institutional ownership persistence and order-book absorption are also incompletely observed. These limitations constrain attribution; they do not turn missing observations into evidence of liquidation.
Prospective tests use the next comparable reporting observations and the same measurement conventions. They assess persistence and falsification without changing approved scoring inputs, weights or regime thresholds.
Structural Conclusion: The evidence supports measurable changes in market structure and capital conditions while limiting claims about investor identity, causation and persistence.
Executive Summary
The participation repair extended beyond capitalization-weighted leadership. SPY declined 0.43%, while equal-weight RSP gained 1.14% and small-cap IWM gained 1.96%. S&P 500 participation above the 50-day moving average increased from 45.12% to 58.05%, crossing a majority threshold. The change strengthened intermediate-horizon breadth alongside further expansion above the 200-day average.
The counterweight came from credit, liquidity and deployment. Investment-grade, high-yield and CCC-and-lower spreads widened; weekly-average reserves declined $59.533 billion; and equity ETF creations slowed from +$43.51 billion to +$12.50 billion. Treasury yields declined and duration-sensitive securities advanced, but lower government yields did not establish improving corporate-credit conditions.
The distinction matters for capital allocation. Falling nominal and real Treasury yields can support duration-sensitive prices while wider credit spreads increase compensation required for borrower risk. Positive ETF creations show continuing implementation, but their slower pace and concentrated distribution do not establish persistent institutional accumulation.
Earnings expectations remained constructive, providing an independent fundamental counterweight. The evidence therefore supports neither synchronized institutional expansion nor demonstrated systemwide funding impairment.
Structural Conclusion: Equity participation strengthened faster than the credit, liquidity and deployment conditions supporting its durability.
Market Structure
RSP’s 1.14% gain against SPY’s 0.43% decline produced a 1.57-percentage-point relative-return advantage. Small-cap IWM gained 1.96%, outperforming SPY by 2.39 percentage points. Value exposure through VTV rose 0.73%, while growth exposure through VUG fell 1.33%. Weighting, capitalization and style materially altered the week’s outcome; a capitalization-weighted benchmark alone did not describe underlying participation.
S&P 500 participation above the 20-day moving average increased from 68.58% to 69.78%; 50-day participation rose from 45.12% to 58.05%; and 200-day participation increased from 51.88% to 56.06%. The intermediate majority crossing distinguishes October 23 from October 16, when fewer than half of constituents remained above their 50-day averages. The longer-horizon majority also expanded.
These measures describe trend alignment, not share ownership. Moving-average thresholds change, constituent cohorts can differ and relative outperformance need not imply positive absolute performance for every security. The three horizons belong to one participation domain rather than three independent capital signals. Equal-weight and small-cap strength add useful relative-performance evidence but do not identify discretionary institutional buyers.
The next comparable Friday observations provide the persistence test. Sustained majority 50-day breadth, a stable or expanding 200-day majority and continued equal-weight relative strength would support the repair. Reversal across those measures would challenge its durability.
Structural Conclusion: Equal-weight, small-cap and intermediate-horizon participation strengthened, but price relationships did not establish persistent institutional accumulation.
Credit & Liquidity Conditions
Weekly-average reserve balances declined $59.533 billion, approximately 1.97%, to $2.963 trillion, while Treasury General Account balances increased $68.629 billion to $952.002 billion. Reserve Bank credit declined only $0.789 billion, limiting an interpretation of broad Federal Reserve asset contraction. Aggregate reverse repos declined $4.953 billion, with most of the change occurring in foreign-official arrangements rather than domestic overnight reverse-repo usage.
Treasury cash accumulation is consistent with reduced reserve availability, subject to other balance-sheet offsets. The observations do not directly measure repo-market funding costs, dealer balance-sheet capacity or the depth available to absorb large transactions. Lower reserves therefore do not independently establish systemwide funding impairment.
Under the matched October 15–22 comparison, investment-grade option-adjusted spreads widened from 84 to 89 basis points, aggregate high yield from 323 to 340, and CCC-and-lower from 1,278 to 1,340. The CCC-minus-aggregate-high-yield differential increased from 955 to 1,000 basis points, a 45-basis-point expansion.
That differential measures greater absolute spread separation within speculative-grade credit. CCC debt is part of the high-yield universe, and its larger basis-point change did not represent a larger percentage change from its starting spread than aggregate high yield. The finding is increased absolute separation, not independent confirmation from a second credit market or proof of imminent defaults.
Treasury-rate relief provided an important counterweight. The 2-year nominal yield declined from 4.74% to 4.69%, the 10-year from 5.09% to 5.00%, and the 30-year from 5.43% to 5.33% between the Friday observations. The corresponding changes were −5, −9 and −10 basis points.
The 10-year real Treasury yield declined from 2.74% to 2.66%. The approximate nominal-minus-real differential changed from 2.35% to 2.34%. Lower real yields accompanied most of the nominal 10-year rate change, but this arithmetic does not identify the independent contribution of term premium, inflation expectations or liquidity premiums.
A separate October 15–22 comparison aligns credit spreads with government yields. The 10-year Treasury yield fell 14 basis points while corporate OAS widened. Over the same period, LQD’s closing price increased from 103.50 to 104.28, approximately 0.75%. Government-rate relief is consistent with duration-sensitive bond-price support despite adverse credit repricing, although different bond universes prevent exact attribution of LQD’s return.
The financing implication is conditional. Lower government benchmarks can offset wider spreads for some borrowers, while weaker issuers may still face greater risk compensation or reduced market access. All-in borrowing costs depend on matched maturity, credit quality, security structure and financing conditions.
Persistent spread widening accompanied by independently observed funding-rate or market-depth deterioration would strengthen the adverse interpretation. Narrower spreads across ratings with stable reserves and funding conditions would improve confirmation.
Structural Conclusion: Reserve availability weakened and credit-risk compensation increased, while lower Treasury yields provided partial duration and financing relief without establishing credit repair.
Positioning & Convexity
VIX declined from 19.99 to 19.45, VVIX from 109.91 to 109.70, and SKEW from 168.59 to 151.80. VXN increased from 27.13 to 28.30, while MOVE rose from 101.10 to 103.31. These observations distinguish partial broad-equity volatility relief from continued pressure in Nasdaq and Treasury-market volatility.
Lower SKEW concerns reduced option-implied downside asymmetry under its measurement convention. It does not measure the number of investors closing protection or establish a lower probability of loss independently of model assumptions. VIX and VVIX also draw information from related equity-volatility markets and cannot be counted as separate observations of institutional hedging demand.
MOVE supplies a distinct rates-volatility perspective. Higher Treasury-market volatility can influence hedging costs and the willingness of institutions to hold duration or finance leveraged positions, but the index does not itself establish actual balance-sheet contraction.
The negative dealer-gamma condition remains a vendor-model result. Under its assumptions, hedging can amplify price changes around relevant positioning thresholds. The model does not identify actual dealer inventories, forced transactions or the persistence of hedging activity throughout the week. A complete matched net-GEX comparison is unavailable.
The next test is whether volatility relief broadens across equity and rates markets while comparable modeled positioning becomes less adverse. Renewed increases across VIX, VXN and MOVE would weaken the partial-repair interpretation.
Structural Conclusion: Equity risk pricing eased selectively, but rates volatility, Nasdaq volatility and unresolved dealer positioning limited convexity confirmation.
Flow & Allocation Behavior
ETF Action’s matched Thursday-ended series records equity ETF net issuance declining from +$43.51 billion to +$12.50 billion, a reduction of $31.01 billion, or 71.3%. Fixed-income issuance declined from +$14.58 billion to +$11.43 billion but remained positive. Neither aggregate recorded net redemptions.
The figures describe slower primary-market implementation, not the withdrawal of the prior week’s created capital. ETF creations and redemptions can reflect subscriptions, authorized-participant inventory management, portfolio substitution and other implementation activity. Their totals do not identify discretionary institutional ownership or conviction.
ETF Channel’s October 23 week-over-week category observations showed approximately +$1.5 billion in Technology, +$850 million in Health, −$365.3 million in Utilities and −$1.5 billion in its vendor-defined Consumer category. Consumer includes multiple types of consumer exposure and is not an XLP-only or consumer-staples classification.
Technology issuance was concentrated. SMH recorded approximately +$1.9 billion in weekly creations, exceeding the conventional Technology category’s approximately +$1.5 billion total. Subject to source rounding and classification, the remaining category funds collectively recorded approximately $400 million in net redemptions. The result does not establish that every other fund experienced withdrawals.
ETF Channel separately classifies leveraged and inverse technology products. Those flows cannot be merged with the conventional Technology category or treated as equivalent unlevered exposure. ETF Channel and ETF Action also cover different fund universes and cannot be netted together.
The persistence test is whether creations remain positive and become more broadly distributed over subsequent comparable windows. A continued concentration in one product, followed by fading aggregate issuance, would weaken the broad-accumulation interpretation.
Structural Conclusion: Capital implementation remained positive but decelerated materially, with concentrated sector issuance and incomplete evidence of persistent institutional demand.
Structural Participation Integrity
SPI™ increased to 59.2 from 57.1. S&P 500 participation above the 20-day average rose from 68.58% to 69.78%; 50-day participation increased from 45.12% to 58.05%; and 200-day participation rose from 51.88% to 56.06%. The majority crossing at the intermediate horizon marks a measurable extension of the prior week’s repair.
Equal-weight and small-cap outperformance supplied further information about participation outside capitalization-weighted leadership. RSP gained 1.14%, IWM 1.96%, and SPY declined 0.43%. These are related equity-market observations, not independent measurements of capital deployment.
The remaining SPI™ dimensions provided less confirmation. Higher VXN and MOVE limited volatility-compression evidence. Lower reserve balances weakened liquidity-mechanics support. Participation elasticity and market absorption remained incompletely observed because the record did not quantify market depth or sustained large-order execution capacity.
The five SPI™ domains remain breadth, concentration, volatility compression, liquidity mechanics and participation elasticity. Improved breadth cannot substitute for the unobserved dimensions or establish that incremental capital can enter without disproportionate price impact.
Sustained majority intermediate breadth with stable long-horizon participation would support integrity. A reversal in breadth accompanied by deteriorating credit, liquidity and relative performance would weaken it.
Structural Conclusion: Participation repair reached intermediate-horizon majority levels but still lacked consistent credit, liquidity and absorption confirmation.
Global Propagation Conditions
Developed-market exposure through VEA fell 0.63%, while VWO declined 2.05% and EEM 1.34%. The developed-versus-emerging relationship improved because developed exposure fell less, not because both strengthened. EFA declined approximately 0.89%, providing a separate developed-market benchmark with a different constituent universe.
China and Japan also diverged. FXI declined approximately 4.52%, compared with a 0.82% decline in EWJ. The difference identifies geographic and benchmark sensitivity, but local-market conditions, sector composition and currency translation prevent attributing it to a common cross-border capital decision.
Defensive exposures were uneven. GLD declined approximately 4.03%, while Treasury-duration proxies advanced: TLT gained 1.61%, EDV 2.47%, and ZROZ 2.93%. The Treasury funds share substantial long-duration exposure. Their price gains are related transmission observations, not three independent confirmations of defensive capital migration.
Falling long-term Treasury yields provide a measurable explanation for the direction of duration-sensitive price performance, while differences in effective duration and convexity can contribute to differing magnitudes. The observed returns do not establish organic ETF subscriptions or the motives of final investors.
Positive and persistent participation across developed and emerging exposures, supported by currency-adjusted returns and independent capital evidence, would strengthen global propagation. Continued negative absolute returns despite favorable relative relationships would leave confirmation incomplete.
Structural Conclusion: Global participation remained uneven, while Treasury-duration strength and gold weakness prevented a uniform defensive-capital interpretation.
Advanced Signal Layer
PIR™ strengthened, reflecting RSP’s 1.57-percentage-point relative-return advantage over SPY and the improvement in intermediate-horizon breadth. The relationship supports participation broadening, not directly measured passive or active institutional ownership.
CQR™ remained conflicted. LQD’s closing price increased approximately 0.75% in the matched October 15–22 comparison, while investment-grade spreads widened 5 basis points and the 10-year Treasury yield declined 14 basis points. Duration relief offers a plausible price-support mechanism, but the bond universes and durations differ. Higher bond prices did not independently establish credit repair.
HPR™ remains provisional. A complete matched October 23 equity-versus-index put/call relationship is unavailable. Existing options-volume observations do not identify hedge ownership, whether positions were opened or closed, or the purpose of the activity. Missing historical verification is a measurement limitation, not a negative hedge signal.
DFR™ weakened under the matched issuance windows as equity ETF creations decelerated 71.3% while remaining positive. GPR™ remained relatively favorable for developed versus emerging exposures even though both reference groups recorded negative absolute returns.
These relationships provide distinct analytical perspectives, but several overlap with the underlying breadth, credit, issuance and geographic observations. Their agreement cannot be counted as additional independent capital confirmation. Relative prices, options relationships and primary-market fund creations answer different questions and do not identify the same investors.
Structural Conclusion: Improving participation and selected relative relationships did not establish synchronized institutional risk deployment.
CMX — Convexity Metrics Index
CMX™ increased to 53.9 from 53.5. Lower VIX, VVIX and SKEW modestly improved broad-equity volatility conditions, while higher VXN and MOVE limited the repair.
The negative dealer-gamma condition remained provisional as evidence of actual positioning. Without comparable same-vendor net-exposure magnitudes, consistent expiration assumptions or observed dealer books, the comparison cannot quantify the change in dealer inventory or identify forced hedging.
Sustained volatility declines across equity and rates markets would strengthen the repair. Renewed increases in growth-sensitive and rates volatility, accompanied by adverse comparable dealer-model observations, would challenge it.
Structural Conclusion: Convexity conditions improved modestly, while the magnitude and persistence of dealer-mediated transmission remained uncertain.
PDCS — Pre-Deployment Capital Signals
PDCS™ declined to 58.3 from 61.9. The 3.6-point reduction reflects weaker implementation momentum alongside less supportive credit and reserve conditions. Equity ETF creations decelerated materially, bond issuance also slowed, and spreads widened across credit-quality tiers. Reserve balances declined as Treasury cash increased.
Lower government yields provided an offset. The 10-year nominal Treasury yield declined 9 basis points, while the 10-year real yield declined 8 basis points over the Friday comparison. Those changes can support duration-sensitive valuations and reduce benchmark financing costs, but they do not establish better credit access for weaker borrowers or increased institutional commitment.
The evidence therefore separates continued deployment activity from its durability. Positive creations are observable; investor identity, holding persistence and market absorption remain incompletely measured.
Renewed, broadly distributed creations with narrower spreads and stable funding conditions would strengthen confirmation. Persistent issuance deceleration, especially if accompanied by net redemptions and further credit deterioration, would challenge it.
Structural Conclusion: Capital implementation continued, but the conditions supporting persistent additional risk allocation weakened.
GFP — Global Propagation Framework
GFP™ declined to 57.6 from 59.0. Domestic equity participation improved without comparable positive performance across developed and emerging international exposures.
VEA’s 0.63% decline was smaller than VWO’s 2.05% decline, while EFA also outperformed EEM in relative terms. The favorable relationship primarily described differing degrees of weakness. FXI’s larger decline relative to EWJ reinforced geographic differentiation.
These observations do not identify a common source of international capital withdrawal. Country composition, currency translation, sector weights and overlapping benchmarks limit attribution. A relative improvement cannot substitute for positive absolute global participation.
Sustained broadening across developed and emerging markets, accompanied by stronger financing and currency-adjusted evidence, would improve propagation. Continued divergence would constrain it.
Structural Conclusion: Relative geographic resilience did not establish synchronized international participation or broad cross-border capital confirmation.
PLMT — Post-Linear Market Structure
VICA retains Fragile Stabilization for October 23, unchanged from October 16 but with weaker supporting conditions. Participation broadened, ETF creations remained positive, Treasury yields declined and broad-equity volatility eased. These observations argue against declaring completed structural deterioration.
Wider corporate-credit spreads, lower reserve availability, slower positive issuance and uneven international participation argue against declaring Broad Participation Expansion or a completed Convexity Repair Phase.
The classification evaluates competing system conditions rather than a predetermined price path. Institutions can adapt through different instruments, financing arrangements and hedging responses while common capital, credit and liquidity constraints influence market outcomes. The evidence must establish convergence across distinct conditions before supporting a regime transition.
A constructive transition would require sustained majority participation, narrower spreads across ratings, renewed broadly distributed issuance, stable reserve and funding conditions, and more coherent global participation. Deterioration would require reversal in participation alongside continued credit widening, weakening implementation and adverse funding or volatility transmission.
These are prospective tests, not automatic score or regime thresholds. The next comparable weekly observations should retain the same breadth universe, Thursday credit and ETF issuance windows, Wednesday reserve averages and Friday market-price comparisons. ICMI™’s Defensive Capital Migration classification increases caution but does not determine PLMT™ mathematically.
Structural Conclusion: Participation resilience persisted without sufficient independent convergence to replace Fragile Stabilization with a stronger or weaker regime.
What information did the system gain this week?
October 16 established stronger equity participation alongside weaker credit and convexity confirmation. October 23 added three measurable changes in the relationships among market components.
Intermediate-horizon breadth crossed a majority while the positive equity ETF issuance impulse slowed sharply. The CCC-versus-high-yield spread differential widened, revealing greater absolute separation within speculative-grade credit. Positive conventional Technology ETF issuance was concentrated in SMH, whose net creations exceeded the category total.
Treasury and global comparisons refined the interpretation. Lower nominal and real Treasury yields supported duration-sensitive prices while credit spreads widened. Developed-market exposures outperformed emerging-market references relatively, although both declined in absolute terms.
These observations distinguish participation maturity, borrower-quality differentiation, concentrated implementation, discount-rate transmission and geographic propagation. They are not five independent votes on one capital-flow outcome.
The incremental information lies in the relationships among independently measured conditions and the contradictions those relationships expose.
Structural Conclusion: The system gained evidence that stronger equity participation coexisted with slower implementation, greater absolute credit differentiation and incomplete global confirmation.
Three Hidden-State Discoveries
1. Majority participation emerged while the equity issuance impulse weakened.
S&P 500 participation above the 50-day moving average increased from 45.12% to 58.05%, crossing a majority threshold. Over matched ETF Action reporting windows, equity net issuance declined from +$43.51 billion to +$12.50 billion, a 71.3% deceleration.
The combination distinguishes improved trend alignment from the pace of new ETF primary-market implementation. A benchmark-price reading would miss the issuance change, while a fund-flow reading alone would miss the participation repair.
The plausible mechanisms include repricing, allocation rotation and changes in existing holdings without an equally strong new creation impulse. The evidence does not isolate which explanation dominated. Breadth and issuance also cover different universes and endpoints, so their relationship does not establish common investor behavior.
The strongest contradictory evidence is that net creations remained positive. The unusually large preceding window may also magnify apparent deceleration.
Confirmation: Intermediate breadth remains above a majority over the next comparable weekly observations while equity issuance continues to slow and credit confirmation fails to improve.
Falsification: Persistent breadth gains are joined by renewed, broadly distributed creations and narrower credit spreads. A loss of majority breadth would instead invalidate the participation-repair premise.
Capital Consequence: Stronger breadth supports confidence in the resilience of existing exposure but does not independently justify proportional increases in institutional risk budgets.
Structural Conclusion: Equity participation broadened without comparable confirmation from the current issuance impulse.
2. Aggregate high-yield spreads understated the absolute separation of the weakest credit tier.
CCC-and-lower OAS widened 62 basis points, compared with 17 basis points for aggregate high yield. The CCC-minus-high-yield differential increased from 955 to 1,000 basis points, a 45-basis-point expansion.
The aggregate high-yield reading concealed the larger absolute spread repricing within its lowest-rated subset. A possible mechanism is greater compensation for refinancing constraints, recovery uncertainty or weaker-credit risk exposure.
The data do not isolate those mechanisms. The indexes overlap, have different starting spread levels and contain different securities. Because CCC spreads began at a substantially higher level, their larger absolute basis-point move does not imply greater proportional widening than the aggregate high-yield index.
The strongest limitation is therefore the difference between absolute spread separation and independent evidence of deteriorating borrower funding access.
Confirmation: The CCC-minus-high-yield differential remains elevated or widens over subsequent matched Thursday observations while CCC spreads remain high or increase.
Falsification: CCC spreads tighten and the differential contracts persistently. Contraction caused only by worsening aggregate high yield would not establish lower-tier repair.
Capital Consequence: Credit exposure requires analysis of borrower quality, refinancing sensitivity and liquidity rather than reliance on aggregate high-yield spreads alone.
Structural Conclusion: The lowest-rated credit tier required greater absolute spread compensation than the aggregate change revealed.
ETF Channel recorded approximately +$1.5 billion in weekly net creations for its conventional Technology category, while SMH alone recorded approximately +$1.9 billion.
Subject to source rounding and classification, the remaining category funds collectively recorded approximately $400 million in net redemptions. The positive category total therefore did not describe the distribution of implementation across its constituents.
Selective semiconductor exposure is a possible explanation. Temporary rebalancing, instrument substitution and ETF creation/redemption mechanics remain alternatives. The figures do not identify final institutional owners or establish that all other funds experienced withdrawals.
The strongest contradiction is that the Technology category remained positive overall and individual funds outside SMH also recorded creations. The negative balance applied to their combined total.
Confirmation: Subsequent comparable ETF Channel windows remain dependent on SMH while the rest of the conventional Technology category records weak or negative combined net issuance.
Falsification: Positive issuance broadens across multiple other technology funds, and the category excluding SMH turns positive over sustained comparable observations.
Capital Consequence: Institutional allocation analysis should distinguish concentrated product implementation from broad sector accumulation and test the persistence of the distribution.
Structural Conclusion: Technology issuance remained positive, but its concentration did not establish broad sector-level capital commitment.
What did VMSI™ discover that price alone did not reveal?
Neither the capitalization-weighted equity decline nor the Treasury-duration recovery described the full change in institutional market conditions. Intermediate S&P 500 participation crossed a majority as positive equity ETF issuance slowed. Corporate-credit spreads widened while lower government yields supported duration-sensitive bond prices. Positive Technology issuance concealed concentrated implementation, while developed-market relative resilience coexisted with negative absolute international returns.
The resulting distinction is between participation, financing conditions, price support and capital attribution. Improvement in one does not validate the others. Stronger participation and modest volatility relief can therefore coexist with weaker deployment and migration assessments without forcing the observations into a uniformly bullish or bearish interpretation.
The framework identifies relationships that a single price series cannot resolve. It does not claim to observe specific institutional trades or infer intent from performance alone.
Structural Conclusion: Market prices were insufficient to identify the breadth, financing quality and durability of underlying institutional participation.
Earnings Topline
Forward Earnings Constructive.
FactSet’s October 23 update placed blended third-quarter 2026 S&P 500 earnings growth at 29.5%. Approximately 24% of companies had reported, with 83% exceeding EPS estimates. Aggregate earnings exceeded estimates by 2.1%, below the five-year average surprise magnitude of 7.5%. The historical comparison covers completed reporting seasons rather than identical early-season samples.
Forward fourth-quarter earnings-growth expectations increased from 28.6% in FactSet’s October 16 publication to 29.2% in its October 23 publication, an increase of 0.6 percentage points. The forward 12-month P/E ratio declined from 19.0 to 18.7, below the five-year average of 19.8.
The directly dated forward comparisons support a constructive aggregate earnings outlook. The separate third-quarter blended growth comparison remains subject to the discrepancy between FactSet’s October 16 printed estimate and the October 23 publication’s retrospective prior-week reference.
Sector revisions were uneven. Energy estimate improvements and positive surprises in Information Technology and Financials supported aggregate results, while Health Care revisions and selected negative surprises constrained uniform confirmation.
Earnings expectations are a fundamental counterweight to weaker credit and deployment conditions. They do not substitute for observed institutional ownership, capital absorption or improved financing terms.
Structural Conclusion: Forward earnings expectations improved and valuation multiples moderated, while smaller surprise magnitude and uneven revisions limited the breadth of fundamental confirmation.
Institutional Capital Migration Index™
Component
Score
Weekly Change
Trend
Interpretation
ETF Capital Flows
54.1
−2.8
Slowing
Equity and bond ETF net creations stayed positive but decelerated.
Dealer Positioning
49.0
−0.6
Defensive / provisional
Negative-gamma condition is a vendor model, not verified dealer inventory.
Liquidity Footprint
49.7
−2.5
Weaker
Reserve averages fell; TGA increased. Do not assert a funding crisis.
Partial equity participation repair without independent deployment/credit/system confirmation.
The five components retain equal 20% weights. Their arithmetic mean is 48.72, reported as 48.7. The composite declined from 50.9, moving from Mixed/Neutral into Defensive Capital Migration.
The classification reflects weaker assessed capital-migration conditions, not direct evidence of broad discretionary institutional selling. Arithmetic consistency does not remove component uncertainty or make overlapping economic observations independent.
Institutional Capital Forensics™
ICMI™ declined to 48.7 from 50.9. The decrease reflects slower ETF issuance, weaker reserve availability, wider credit spreads, provisional dealer positioning and divergent cross-asset confirmation. Credit Market Confirmation fell 3.5 points, consistent with widening across investment-grade, high-yield and CCC spreads. ETF Capital Flows weakened despite positive net creations; deceleration does not establish aggregate withdrawal.
The creation totals are observable, but their persistence and attribution remain incomplete. The record does not determine whether final investors increased long-term allocations, substituted implementation vehicles, rebalanced portfolios or reduced total economic exposure. Market-depth and ownership records do not independently establish sustained absorption.
The Technology concentration observation improves distributional analysis without identifying final ownership. Similarly, lower reserves and wider credit spreads describe financial conditions, not observed institutional order execution. Missing ownership and absorption evidence must not be treated as evidence that absorption failed.
IC-VMSI™ retains six dimensions: Ownership Stability, Passive Demand, Active Manager Demand, Flow Momentum, Market Absorption and Institutional Conviction. Its evidence progression remains Alert → Absorption → Persistence → Confirmation. The available record supports implementation observations more directly than it supports verified ownership persistence, active-manager conviction or absorption.
The next confirmation requires sustained flow evidence aligned with improving credit and liquidity, supported where available by independent holdings or execution data. Correlated price, volatility and fund-flow observations cannot replace those missing domains.
ICMI™ Confirmation: Defensive migration conditions without verified broad institutional liquidation.
Structural Conclusion: Capital implementation remained active but became more selective as the independent conditions supporting persistent accumulation weakened.
Final Institutional Assessment
VMSI™ stands at 53.6, IC-VMSI™ at 63.0, and ICMI™ at 48.7. The defining change was stronger domestic equity participation without corresponding improvement in credit, reserve liquidity and capital deployment. Intermediate-horizon breadth crossed a majority, while equal-weight, small-cap and value exposures outperformed capitalization-weighted or growth-sensitive benchmarks. Positive ETF issuance continued but slowed materially, and sector implementation remained concentrated.
The Fragile Stabilization assessment retains both sides of this configuration. Falling nominal and real Treasury yields supported duration-sensitive prices while wider credit spreads indicated higher borrower-risk compensation. Constructive earnings expectations and partial equity-volatility relief opposed a uniform deterioration assessment. Lower reserve availability, decelerating issuance and uneven international participation constrained the case for sustained expansion.
The relationship between Treasury rates and credit is central. Lower government yields can improve the valuation and financing environment for duration-sensitive exposures without resolving the risk premium or funding access of weaker corporate borrowers. Treasury ETF appreciation is evidence of rate transmission, not independently verified defensive capital inflows. Similarly, positive primary-market ETF creations establish implementation activity but not the identity or persistence of final institutional positions.
The next regime test is convergence. Sustained intermediate-horizon participation, narrower corporate spreads, calmer cross-market volatility, broader positive issuance and stronger international participation would support expansion. Reversal in constituent breadth accompanied by persistent credit widening, deteriorating deployment and independently observed funding or hedging pressure would challenge stabilization.
For institutional sizing, participation repair supports the resilience of existing exposure but does not independently justify expanding gross risk budgets without confirmation from financing, liquidity and absorption conditions. The same incomplete evidence does not justify equating weaker issuance or a defensive migration classification with verified systemwide liquidation.
ICMI™ Confirmation: Defensive Capital Migration, with incomplete ownership and absorption attribution.
Regime Assessment: Fragile Stabilization, unchanged and weakening.
Structural Conclusion: Participation strengthened, but the independent evidence supporting durable institutional risk deployment weakened.
About VMSI™
VMSI™ — VICA Market State Index is an observational institutional framework designed to identify changes in the conditions shaping market behavior.
Rather than interpreting indicators independently, VMSI™ evaluates relationships among participation, liquidity, credit, positioning, volatility, capital deployment and global propagation.
Each weekly publication integrates observable evidence, proprietary relationship measures and structural validation to assess the prevailing institutional market state.
Scientific Standard
Observations measure conditions. Relationships reveal information. Patterns reveal structure. Independent confirmation strengthens confidence in a signal. Contradictory evidence defines its limits.
Weekly evidence tests the framework’s implications; it does not prove the theory. Falsification conditions determine when an assessment must change.
IC-VMSI™ Definition
IC-VMSI™ measures institutional core capital-force and deployment behavior through observable allocation, creation-and-redemption activity, ownership structures, portfolio positioning and benchmark-linked investment behavior.
The framework does not attempt to identify individual institutional trades. Price, momentum, trading volume and price-driven AUM appreciation alone do not establish institutional capital deployment.
Underlying model construction remains proprietary to VICA Research.
Disclaimer / Trademark Notice
Disclaimer
VMSI™ is a proprietary observational market framework developed by VICA Research. This publication is provided for informational purposes only and does not constitute investment advice or a recommendation to buy or sell any security.
Conclusions reflect evidence-based interpretations of information available for the stated measurement period and may change as new evidence becomes available. Model assumptions, incomplete capital-flow attribution, missing dealer observations and differences in reporting conventions limit the precision of certain assessments.
Trademark Notice
VMSI™, IC-VMSI™, ICMI™, Institutional Capital Migration Index™, Institutional Capital Forensics™, Market Mechanics, PLMT, PIR™, CQR™, HPR™, DFR™, GPR™ and associated framework names are trademarks of VICA Research.