The VMSI™ Composite increased to 57.6, with IC-VMSI™ at 64.9 and the Institutional Capital Migration Index™ at 51.7, reflecting an improved assessment of participation, reserve liquidity, and volatility conditions. The recovery remained selective: CCC-and-lower credit weakened, global confirmation was incomplete, and capital-flow and dealer-positioning qualifications left Selective Synchronization Expansion unchanged.
VMSI™ Snapshot
Indicator
Score
Weekly Change
Institutional State
VMSI™ Composite
57.6
+1.7
Institutional conditions improved selectively as participation and reserve liquidity strengthened; credit and global confirmation remained uneven.
Momentum
60.1
+2.3
Short-term participation improved and equal-weight equities outperformed, while intermediate breadth and small-cap confirmation remained limited.
Liquidity
57.0
+1.7
Higher reserve balances and lower Treasury cash holdings improved liquidity availability without establishing market-wide absorption.
Volatility & Hedging
57.2
+0.8
Equity and rates volatility declined, while higher tail asymmetry and uncertain dealer positioning constrained confirmation.
Safe Haven Demand
50.5
+0.7
Gold and Treasury-duration prices recovered; price gains alone do not establish the source or purpose of defensive demand.
Advanced Framework Layer
Advanced Framework Layer scores are proprietary VICA Research measures. Public reporting presents framework state and directional change; underlying construction methodology remains proprietary.
Framework
Score / State
Weekly Change
Institutional State
SPI™
55.4
+3.7
Substantial short-term participation repair; longer-horizon breadth and capitalization-tier confirmation remained incomplete.
CMX™
57.2
+0.6
Lower implied volatility improved conditions, offset by higher SKEW and conflicting modeled dealer exposure.
PDCS™
63.7
+0.7
Reserve availability and aggregate credit pricing improved, while allocation evidence and CCC credit limited deployment confirmation.
GFP™
61.5
−1.3
Domestic repair outpaced developed international confirmation, despite selective emerging-market resilience.
IC-VMSI™
64.9
+0.3
Capital force remained selectively constructive; technical ETF activity and incomplete ownership and absorption evidence limited attribution.
PLMT™
Selective Synchronization Expansion
Unchanged
Participation and liquidity improved without sufficient convergence across credit, positioning, and global transmission to establish a broader transition.
Signal Integrity
The measurement cutoff is October 9, 2026, with October 2 providing the historical score comparison. Market prices retain matched Friday closes. Raw ETF price returns exclude distributions and are not treated as creations, redemptions, or institutional transactions.
Moving-average participation retains the established S&P 500 series. Exact prior/current closing pairs for daily advancers, decliners, and new highs/lows remain incomplete under a single constituent and measurement convention; no weekly change is inferred for those measures. A higher share of stocks above a moving average is an endpoint observation, not proof of persistent ownership or accumulation.
Federal Reserve liquidity uses weekly averages ending October 7 versus September 30. Credit spreads use October 1–8 observations. Aggregate ETF flows retain five-session windows ending on those Thursdays, consistent with the preceding report. Later-published Friday-ended flows are disclosed separately because they materially change the allocation comparison.
Dealer exposure remains modeled, with no reliable matched weekly Net GEX change. An unchanged dealer score does not establish unchanged positioning. Fund-level implementation effects and incomplete capital-flow attribution constrain confidence in the migration assessment; supplemental observations do not independently establish score changes.
Executive Summary
The week improved the domestic market’s participation structure without producing uniform confirmation. The S&P 500 advanced approximately 1.15%, the Nasdaq Composite 0.64%, and the Dow 0.93%. Small-cap exposure, measured by IWM, declined approximately 0.92%.
Equal-weight performance strengthened, and the S&P 500’s shortest moving-average participation measure crossed above a majority of constituents. Reserve availability increased, and measured volatility declined. The contradictions were more selective than in the prior week: aggregate credit spreads narrowed while CCC-and-lower spreads widened, developed international equities lagged, and ETF allocation conclusions depended materially on the reporting endpoint.
Structural Conclusion: Domestic market repair was measurable, but sustained participation and independent capital confirmation remained incomplete.
Market Structure
RSP gained approximately 1.58%, compared with 1.16% for SPY. The roughly 0.42-percentage-point advantage indicates that the weekly advance was less dependent on capitalization weighting. Value exposure also outperformed growth over the week.
The improvement occurred within an uneven equity structure. IWM declined, and intermediate-term participation remained well below a majority of S&P 500 constituents. Equal-weight outperformance therefore supports broader large-cap participation, not a conclusion that all capitalization tiers or institutional portfolios moved together.
Structural Conclusion: The advance broadened within large-cap equities without establishing market-wide participation.
Credit & Liquidity Conditions
Weekly-average reserve balances increased approximately $81.6 billion as the Treasury General Account declined approximately $68.4 billion. Reserve Bank credit increased only about $3.9 billion. The balance-sheet configuration points principally to changes in reserve-absorbing liabilities rather than substantial asset expansion; aggregate reverse repos remained broadly stable and consisted predominantly of foreign-official balances.
Credit pricing improved outside the weakest segment. Investment-grade OAS narrowed from 86 to 82 basis points, and aggregate high-yield OAS from 324 to 315 basis points. CCC-and-lower OAS widened from 1,215 to 1,252 basis points. The ten-year nominal Treasury yield declined four basis points to 5.24%, while its real yield declined one basis point to 2.91%. These are secondary-market pricing observations, not a direct measure of new borrowing costs or financing access for every issuer.
Structural Conclusion: Reserve quantities and aggregate credit pricing improved, but real-rate relief was limited and the weakest credit tier did not participate.
Positioning & Convexity
VIX declined from 15.31 to 14.84, VVIX from 87.02 to 84.88, VXN from 21.20 to 20.55, and MOVE from 107.29 to 98.47. The volatility complex therefore showed broad weekly compression across equity and Treasury-rate measures.
SKEW moved in the opposite direction, rising from 144.88 to 154.34. Broad implied volatility and option-implied tail asymmetry supplied different information. Neither those indices nor put/call volume identifies trade initiation, hedging purpose, or dealers’ net positions; competing gamma models cannot resolve the missing weekly inventory observation.
Structural Conclusion: Measured volatility eased without demonstrating equivalent normalization of tail asymmetry or dealer exposure.
Flow & Allocation Behavior
ETF Action’s matched Thursday-ended series records equity ETF inflows declining from $23.17 billion to $14.30 billion, while bond ETF inflows increased from $23.38 billion to $25.16 billion. Subscriptions remained positive in both categories, but equity issuance slowed under the established reporting convention.
The separate Friday-ended comparison gives a different result: equity inflows increased from $28.41 billion to $32.24 billion, while bond inflows declined from $29.71 billion to $21.37 billion. That report includes a $14.14 billion one-day DXJ creation flagged by the provider as potentially related to a custom rebalance. The activity is not discarded, but neither its investment intent nor an adjusted “organic” total can be established from the available record.
As supplemental context, ICI reported a $72.27 billion increase in money-market fund assets for the week ended October 7. This is an asset change over a separate window, not an amount to add to ETF flows or proof of equity liquidation.
Structural Conclusion: Positive fund issuance is supported across both ETF windows; a uniform acceleration in discretionary equity deployment is not.
Structural Participation Integrity
SPI™ increased to 55.4 from 51.7.
Twenty-day participation rose from 26.44% to 54.49%, a gain of 28.05 percentage points. Fifty-day participation increased from 24.65% to 34.93%, and 200-day participation from 42.54% to 47.70%. Every reported horizon improved, with the largest change in the shortest measure.
This supports a material repair assessment, but the measures are correlated expressions of one participation domain. Moving averages themselves change, and Friday endpoints do not establish persistence across subsequent sessions. Equal-weight outperformance broadens the evidence within that domain; missing matched daily breadth counts, weak small-cap performance, and sub-majority longer-horizon readings define its limits.
Structural Conclusion: The participation improvement was substantial, but the evidence supports repair rather than a completed broad-expansion state.
Global Propagation Conditions
Developed international exposure, represented by VEA, declined approximately 1.10%, while VWO gained approximately 0.34%. The difference contrasts with the near-flat developed-versus-emerging relationship described in the prior report. The emerging-market result was not uniform: EEM declined approximately 1.29%, while China large-cap exposure through FXI gained approximately 3.16%.
DXY strengthened approximately 0.27%, while gold and Treasury-duration prices recovered. Currency translation and differences in country and sector composition qualify comparisons among the international funds. The mixed results do not establish a common cross-border capital-flow mechanism.
Structural Conclusion: Domestic participation improved without consistent external confirmation, but international conditions were not uniformly adverse.
Advanced Signal Layer
The relationship measures distinguish relative performance from investment intent. PIR™ reflected improved equal-weight confirmation, while CQR™ showed modest LQD outperformance relative to HYG; the latter remains sensitive to duration and does not replace direct spread evidence.
HPR™ reflected a lower equity-to-index put/call relationship at the Friday endpoint, not a verified increase in institutional protection purchases. DFR™ weakened under the controlling Thursday-ended flows but improved under the separate Friday-ended series. GPR™ weakened as VEA underperformed VWO. No combination of these ratios identifies the owners, motives, or persistence of the underlying transactions.
Structural Conclusion: The relationships separate participation repair from credit-quality dispersion and window-sensitive deployment evidence.
CMX — Convexity Metrics Index
CMX™ increased to 57.2 from 56.6.
Lower MOVE and equity-volatility readings support reduced observed volatility pressure. The implied-volatility horizon structure remained upward sloping, with VIX below the three-month measure; that is not a statement about the VIX futures curve.
Higher SKEW provides the principal contradiction. It describes adverse asymmetry in option-implied returns, not the absolute cost of every protective put or the realized probability of a future loss. Model-dependent dealer estimates do not establish a stabilizing weekly inventory change.
Structural Conclusion: Volatility relief improved the convexity assessment without resolving tail-distribution or dealer-positioning uncertainty.
PDCS — Pre-Deployment Capital Signals
PDCS™ increased to 63.7 from 63.0.
Higher reserves, narrower aggregate credit spreads, and a slightly lower real discount rate improved several conditions relevant to deployment. The distinction is between available financial capacity and evidence that investors used it.
Equity issuance slowed under the established reporting window, while the later Friday-ended increase carried a material technical-flow qualification. Continued CCC widening limited the credit confirmation. Money-market asset growth provides supplemental context but does not establish that capital was waiting to buy equities.
Structural Conclusion: Conditions for deployment improved more clearly than the evidence established broader, persistent risk allocation.
GFP — Global Propagation Framework
GFP™ declined to 61.5 from 62.8.
The new contrast was domestic breadth repair alongside another decline in developed international exposure and weaker developed-versus-emerging relative performance. This distinguishes the current week from a simple repetition of previously weak international conditions.
China and VWO gains, together with recovering gold and Treasury-duration prices, oppose a uniformly deteriorating global interpretation. Overlapping funds and currency exposure limit the independence of those observations.
Structural Conclusion: Global confirmation lagged the domestic recovery, without demonstrating synchronized international stress.
PLMT — Post-Linear Market Structure
The regime remains Selective Synchronization Expansion.
Participation, reserve availability, and aggregate credit pricing improved, while CCC credit, longer-horizon breadth, and geographic confirmation remained less supportive. Uncertain dealer positioning and flow attribution limit confidence; their absence is not additional evidence of deterioration.
Broader expansion requires sustained participation repair across horizons and capitalization tiers, supported by credit, deployment, and global confirmation. A defensive transition requires adverse changes to converge across independent channels rather than remain concentrated in one credit tier. Neither transition is established by the current evidence.
Structural Conclusion: The system remains selectively supported, with genuine repair and material constraints coexisting.
What information did the system gain this week?
October 2 paired stronger reported subscriptions with weaker participation and credit. October 9 altered that configuration: participation improved, aggregate credit repaired, and deterioration persisted within CCC-and-lower debt.
The important addition is differentiation within the recovery. Large-cap breadth did not establish small-cap confirmation, aggregate high-yield tightening did not describe its weakest constituents, and lower broad volatility did not imply lower tail asymmetry. Separately, the change in the ETF allocation conclusion between reporting windows showed why a single aggregate flow total could not establish persistent conviction.
Structural Conclusion: The system gained evidence about the boundaries of repair, not merely a stronger set of headline readings.
Three Hidden-State Discoveries
1. Large-cap breadth repair did not become market-wide participation.
More than half of S&P 500 constituents finished above their 20-day averages, and equal-weight exposure outperformed SPY. Yet only 34.93% remained above their 50-day averages, and IWM declined during the same price window. The broadening occurred within a market that remained differentiated by horizon and capitalization.
Sustained improvement in intermediate and longer-horizon breadth, accompanied by small-cap confirmation, would weaken this boundary on the recovery. A retreat in short-term breadth without that extension would instead challenge its durability.
Structural Conclusion: Participation widened, but the evidence did not establish that the recovery had spread across the full equity structure.
2. The headline high-yield improvement concealed greater internal credit dispersion.
Aggregate high-yield OAS tightened 9 basis points, while CCC-and-lower OAS widened 37 basis points. The gap between the two index spreads consequently increased 46 basis points, even as the broad high-yield measure improved.
CCC credit is part of the high-yield universe, so this is internal dispersion, not an additional independent credit domain. Sustained CCC tightening alongside the aggregate would weaken the divergence; renewed broad high-yield and investment-grade widening would challenge the view that deterioration remained concentrated.
Structural Conclusion: The aggregate credit recovery did not describe the weakest borrowers’ market pricing.
3. Volatility compression did not extend to tail asymmetry.
VIX fell 0.47 points while SKEW rose 9.46 points. Lower broad equity implied volatility therefore coexisted with a more negatively skewed option-implied distribution. Unlike a simple decline in the volatility complex, the combination distinguishes the scale of expected fluctuations from their asymmetry.
The interpretation would weaken if SKEW declined persistently alongside contained broad volatility. A renewed volatility rise would challenge the compression premise. Neither outcome is forecast here, and the current readings do not identify protective-put buyers or net dealer hedges.
Structural Conclusion: A quieter broad-volatility reading did not establish a more symmetric option-implied risk distribution.
What did VMSI™ discover that price alone did not reveal?
A positive index week did not show where the recovery stopped. Participation widened within large caps but remained incomplete across horizons and capitalization tiers. Corporate-bond prices recovered while the lowest-quality spread measure deteriorated. The options market priced lower broad volatility without equivalent improvement in asymmetry.
Capital evidence imposed a further limit. More reserves and positive ETF issuance did not identify investment intent, and the direction of relative equity deployment changed with the reporting window. The useful distinction is between observed repair, the mechanisms that might support it, and confirmation that remains missing.
Structural Conclusion: The recovery was observable; its persistence, breadth of financing support, and institutional ownership were not established by price.
Earnings Topline
Forward Earnings Constructive.
FactSet’s October 7 review reported that the calendar-2026 earnings estimate increased 6.2% during the third quarter. Its October 9 blended third-quarter growth estimate stood at 29.6%, up from 29.2% at quarter-end. The former is forecast-revision context; the latter combines reported earnings with remaining estimates. Neither establishes uniform guidance improvement or substitutes for participation, credit, and deployment evidence.
Institutional Capital Migration Index™
Component
Score
Weekly Change
Trend
Interpretation
ETF Capital Flows
54.3
+1.8
Positive / mixed
Both asset classes received net subscriptions; relative momentum changed with the endpoint, and exact component attribution remains incomplete.
Dealer Positioning
50.4
0.0
Unresolved
A matched weekly Net GEX change was unavailable; the unchanged score is not an observation of unchanged dealer exposure.
Liquidity Footprint
53.1
+1.9
Improving
Reserve availability increased as Treasury cash balances declined; direct market-depth and block-absorption evidence remained unavailable.
Credit Market Confirmation
50.0
+0.4
Selective repair
Investment-grade and aggregate high-yield spreads tightened while CCC-and-lower spreads widened.
Cross-Asset Confirmation
50.7
+0.2
Mixed
Domestic equities and Treasury duration recovered, while small-cap and developed international confirmation lagged.
Institutional Capital Migration Index™ Composite
51.7
+0.9
Selective improvement
The migration assessment improved modestly, with material uncertainty in flow attribution and dealer positioning.
The five components retain equal 20% weights. 51.7 remains within the mixed or neutral migration state, not broad accumulation or distribution. Arithmetic consistency does not remove uncertainty in individual components or make overlapping evidence independent.
Institutional Capital Forensics™
ICMI™ increased to 51.7 from 50.8. The largest numerical component increases were Liquidity Footprint and ETF Capital Flows, but their evidentiary support differs. Reserve quantities improved directly; the flow component’s increase cannot be read as an increase in the controlling equity subscription total.
That equity total declined, even though subscriptions remained positive. The later Friday-ended increase was materially affected by activity the provider flagged as potentially technical. Complete fund-level attribution of the component’s precise change remains unavailable. Similarly, Dealer Positioning at 50.4 with no score change does not establish a stable dealer book.
The constructive observations are greater reserve availability and selective credit repair. Their limits are continued CCC widening, incomplete geographic confirmation, and unavailable direct absorption evidence. These conditions support distinguishing institutional capacity from demonstrated broad risk accumulation.
The relationship between VMSI™ and ICMI™ is also bounded by shared inputs. Agreement between the two assessments does not create a second independent observation of the same reserve or credit change.
ICMI™ Confirmation: The migration assessment is modestly stronger, but broad accumulation and exact flow attribution remain unconfirmed.
Structural Conclusion: Improved capital conditions do not eliminate uncertainty about who deployed funds, why they did so, or whether the allocation will persist.
Final Institutional Assessment
VMSI™ stands at 57.6, IC-VMSI™ at 64.9, and ICMI™ at 51.7. The October 9 assessment is stronger because participation and reserve availability improved alongside lower broad volatility and partial credit repair. It is not a finding that all institutional channels strengthened.
The decisive distinction is between breadth of the rebound and durability of the structure. Intermediate participation remained weak, small caps did not confirm the large-cap advance, and the lowest-rated credit segment continued repricing. Flow-window sensitivity and missing matched dealer evidence limit the precision of the capital-confirmation layer.
Sustained breadth improvement accompanied by CCC stabilization, clearer deployment evidence, and broader geographic participation would strengthen the expansion interpretation. Renewed deterioration across those separate channels would weaken it. The current record establishes neither transition.
ICMI™ Confirmation: Selective improvement, with material attribution limits and no confirmation of broad accumulation.
Structural Conclusion: Participation repaired, but durable expansion still required confirmation beyond the headline recovery.
About VMSI™
VMSI™ — VICA Market State Index is an observational institutional framework designed to identify changes in the conditions shaping market behavior.
Rather than interpreting indicators independently, VMSI™ evaluates relationships among participation, liquidity, credit, positioning, volatility, capital deployment, and global propagation.
Each weekly publication integrates observable evidence, proprietary relationship measures, and structural validation to assess the prevailing institutional market state.
Scientific Standard
Observations measure conditions. Relationships reveal information. Patterns reveal structure. Independent confirmation strengthens confidence in a signal. Contradictory evidence defines its limits.
Weekly evidence tests the framework’s implications; it does not prove the theory. Falsification conditions determine when an assessment must change.
IC-VMSI™ Definition
IC-VMSI™ measures institutional core capital-force and deployment behavior through observable allocation, creation-and-redemption activity, ownership structures, portfolio positioning, and benchmark-linked investment behavior.
The framework does not attempt to identify individual institutional trades. Price, momentum, trading volume, and price-driven AUM appreciation alone do not establish institutional capital deployment.
Underlying model construction remains proprietary to VICA Research.
Disclaimer / Trademark Notice
Disclaimer
VMSI™ is a proprietary observational market framework developed by VICA Research. This publication is provided for informational purposes only and does not constitute investment advice or a recommendation to buy or sell any security.
Conclusions reflect evidence-based interpretations of information available for the stated measurement period and may change as new evidence becomes available. Model assumptions, incomplete capital-flow attribution, missing dealer observations, and differences in reporting conventions limit the precision of certain assessments.
Trademark Notice
VMSI™, IC-VMSI™, ICMI™, Institutional Capital Migration Index™, Institutional Capital Forensics™, Market Mechanics, PLMT, PIR™, CQR™, HPR™, DFR™, GPR™, and associated framework names are trademarks of VICA Research.
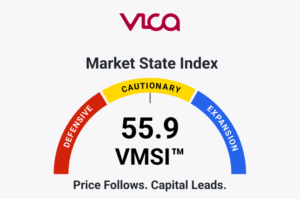
Price Held. Institutional Support Weakened. The VMSI™ Composite declined to 55.9. Headline equity performance remained comparatively resilient, but participation weakened,...
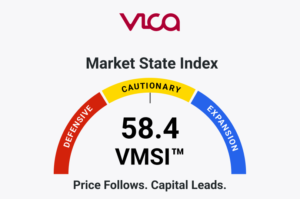
Headline equity performance strengthened while the institutional assessment weakened modestly. The VMSI™ Composite declined to 58.4 as stronger large-cap and...
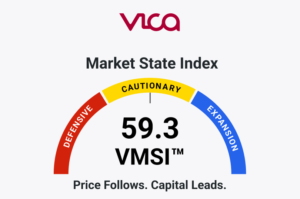
Participation deteriorated across short-, intermediate-, and long-horizon breadth. Volatility conditions improved, while provisional capital-flow evidence supported a stronger—but still selective—deployment...