Headline equity performance strengthened while the institutional assessment weakened modestly. The VMSI™ Composite declined to 58.4 as stronger large-cap and growth momentum was offset by less-supportive liquidity, weaker lower-quality credit, softer observable equity deployment, and incomplete participation repair.
IC-VMSI™ declined to 65.8, while the Institutional Capital Migration Index™ declined to 53.7.
The institutional system remains in Selective Synchronization Expansion.
VMSI™ Snapshot
Indicator
Score
Weekly Change
Institutional State
VMSI™ Composite
58.4
−0.9
Stronger headline momentum contrasted with weaker liquidity, lower-quality credit, uneven participation, and softer capital migration.
Momentum
60.0
+0.6
Large-cap and growth momentum strengthened while small-cap and equal-weight exposures lagged.
Liquidity
56.2
−2.0
Weekly-average reserve conditions weakened as Treasury cash increased; Wednesday endpoints provided a counter-signal.
Volatility & Hedging
59.0
−0.8
Broad equity volatility remained comparatively contained while rates and Nasdaq volatility increased.
Safe Haven Demand
50.3
−0.9
Dollar strength contrasted with weaker gold and Treasury-duration prices; cash-allocation confirmation remained incomplete.
Advanced Framework Layer
Framework
Score
Weekly Change
Institutional State
SPI
55.2
+0.3
Short-horizon breadth repaired while intermediate- and long-horizon participation weakened.
CMX
59.2
+0.2
Equity-volatility structure remained orderly; higher rates volatility and provisional positioning evidence limited the improvement.
PDCS
66.8
−2.0
Weaker reserve liquidity, higher real yields, and lower-quality credit widening reduced deployment support.
GFP
65.4
−0.4
Positive international-equity performance coexisted with dollar strength and regional divergence.
IC-VMSI™
65.8
−2.2
Matched aggregate equity ETF flows weakened while fixed-income flows remained positive; concentration and coverage qualifications remain.
PLMT
Selective Synchronization Expansion
Unchanged
Institutional support remained active but unevenly transmitted.
Advanced Framework Layer scores are proprietary VICA Research measures. Public reporting presents framework state and directional change; underlying construction methodology remains proprietary.
Signal Integrity
The measurement cutoff is September 25, 2026. September 18 approved scores remain the immutable comparison baseline. Market-price comparisons use matched weekly closing observations. Moving-average breadth retains its established S&P 500 series; advancer/decliner observations use the established adjusted-price vendor convention; and new-high/new-low counts use closing 52-week extremes.
Federal Reserve liquidity uses weekly averages through September 23, with Wednesday point-in-time observations maintained separately. Credit spreads retain matched daily-close observations through September 24. ETF-flow evidence retains matched rolling-week reporting windows through September 17 and September 24. These conventions are preserved rather than combined across incompatible measurement windows.
Dealer positioning remains modeled / provisional rather than directly observed inventory. Matched options evidence did not provide sufficient support for a separate HPR™ interpretation this week. Missing or lower-confidence evidence reduces interpretive weight; it is not converted into negative evidence.
Executive Summary
The institutional state weakened modestly despite stronger headline equity performance. The S&P 500 advanced approximately 1.21% and the Nasdaq Composite 2.06%, while small-cap exposure declined. Participation improved at the shortest measured horizon, but that repair did not extend through the broader structure.
Twenty-day breadth improved from 19.08% to 29.82%. Fifty-day breadth declined to 26.44%, 200-day breadth declined to 46.52%, and new lows continued to exceed new highs. Headline strength therefore received only partial confirmation from underlying participation.
Liquidity and credit also became less supportive. Weekly-average reserves declined approximately $83.6 billion as Treasury cash increased approximately $100.1 billion. Credit deterioration remained concentrated below investment grade: high-yield spreads widened 10 basis points and CCC-and-lower spreads 36 basis points, while investment-grade spreads increased only 1 basis point.
Rates added a separate constraint. The 10-year Treasury yield increased approximately 16 basis points, with approximately 15 basis points of that move reflected in the real yield. Breakeven inflation compensation changed little. The evidence identifies where the repricing occurred without assigning a singular cause.
Observable deployment also weakened. Matched aggregate equity ETF flows shifted from approximately +$75.6 billion to −$27.4 billion, while fixed-income ETF flows remained positive.
Structural Conclusion: Headline strength improved without comparable confirmation from participation depth, reserve liquidity, lower-quality credit, and observable equity deployment.
Market Structure
Capitalization-weighted equities strengthened more rapidly than the broader domestic market. The S&P 500 advanced approximately 1.21% and the Nasdaq Composite 2.06%, while small-cap and equal-weight exposures lagged. Growth also materially outperformed value.
Short-horizon participation improved, preventing the week from being characterized as a simple continuation of the prior breadth deterioration. The improvement, however, did not extend through capitalization tiers or longer participation horizons.
Structural Conclusion: The advance was stronger at the capitalization-weighted benchmark level than across the market beneath it.
Credit & Liquidity Conditions
Liquidity weakened under the controlling weekly-average convention. Average reserve balances declined approximately $83.6 billion, while Treasury cash increased approximately $100.1 billion. Wednesday point-in-time observations moved in the opposite direction, providing a meaningful counter-signal without replacing the broader weekly-average deterioration.
Credit weakened selectively rather than systemically. High-yield OAS widened 10 basis points, CCC-and-lower spreads widened 36 basis points, and investment-grade spreads increased only 1 basis point.
Treasury yields rose across the curve. The 10-year nominal yield increased approximately 16 basis points, against a 15-basis-point increase in the corresponding real yield. Inflation compensation changed little.
Structural Conclusion: Reserve conditions weakened and lower-quality credit repriced while the Treasury adjustment was concentrated in real yields.
Positioning & Convexity
Equity volatility remained comparatively orderly. VIX was essentially unchanged near 15, VIX3M declined, and the equity implied-volatility term structure remained upward sloping. Nasdaq volatility increased, while the clearest cross-asset change occurred in rates: MOVE increased approximately 19%.
The short-horizon dealer model finished the week in positive gamma. That provides conditional stabilization evidence, not proof of supportive all-expiry dealer inventory or a precisely measured weekly improvement.
Structural Conclusion: Rates-volatility pressure increased without a comparable expansion in broad equity implied volatility.
Flow & Allocation Behavior
Observable capital deployment weakened. Matched aggregate equity ETF flows shifted from approximately +$75.6 billion to −$27.4 billion, while fixed-income ETF flows remained positive at approximately +$10.9 billion.
The reversal was material but concentrated. A substantial share of the prior week’s equity inflow occurred within one session, while opposing flows across economically similar benchmark vehicles limit conclusions about investor identity and persistence.
IC-VMSI™ declined to 65.8 from 68.0, reflecting a weaker deployment assessment rather than evidence of comprehensive institutional withdrawal.
Structural Conclusion: Available aggregate ETF evidence became less equity-supportive while fixed-income allocation remained positive.
Structural Participation Integrity
SPI increased to 55.2, reflecting a sharp distinction across participation horizons. Twenty-day breadth improved from 19.08% to 29.82%, and daily advancer/decliner participation strengthened materially.
The repair did not extend deeper into the structure. Fifty-day breadth declined from 27.83% to 26.44%, 200-day breadth declined from 49.50% to 46.52%, and closing new highs and lows moved from 5/30 to 3/31.
The small SPI improvement therefore reflects genuine near-term repair without sustained-trend confirmation.
Structural Conclusion: Near-term participation repaired while the broader distribution of sustained trends remained weak.
Global Propagation Conditions
International equity performance remained constructive but differentiated. Developed markets, emerging markets, Japan, and broad global equities advanced, while China weakened.
Dollar appreciation and higher developed-market sovereign yields provided counter-signals. Positive international-equity performance therefore contradicts generalized global impairment, but regional, currency, and rates divergence prevents a broader synchronization conclusion.
GFP declined modestly to 65.4.
Structural Conclusion: International equities supplied price support without establishing uniform geographic or cross-asset confirmation.
Advanced Signal Layer
The proprietary relationship layer separated the principal dimensions of the weekly state. Participation remained weaker beneath capitalization-weighted benchmarks. Credit deterioration remained concentrated lower in the quality spectrum. Global propagation remained constructive but uneven. Observable deployment weakened.
These relationships answer different questions and are not treated as interchangeable confirmations of market direction.
Structural Conclusion: The relationship layer separated price strength from participation depth, credit quality, and capital deployment.
CMX — Convexity Metrics Index
CMX increased modestly to 59.2. Equity implied-volatility structure remained comparatively orderly, with VIX near 15, lower VIX3M, and an upward-sloping term structure. Modeled positive gamma supplied additional but provisional support.
The strongest contradiction was rates volatility, with MOVE increasing approximately 19%. The CMX improvement therefore reflects limited equity-convexity stability rather than broad cross-asset normalization.
Structural Conclusion: The approved CMX reading describes equity-convexity stability, not comprehensive risk normalization.
PDCS — Pre-Deployment Capital Signals
PDCS declined to 66.8 as reserve conditions, real yields, and lower-quality credit became less supportive. These observations describe the environment in which capital can deploy and remain analytically distinct from actual deployment measured through flows.
Investment-grade credit remained comparatively contained, international equities stayed constructive, and fixed-income ETF demand remained positive. The decline therefore represents weaker deployment conditions rather than impaired market functioning.
Structural Conclusion: Deployment conditions weakened without demonstrating a system-wide loss of capital-market access.
GFP — Global Propagation Framework
GFP declined to 65.4 despite positive performance across several international-equity exposures. That price resilience is the strongest contradiction to the weaker framework reading.
The decline reflects incomplete cross-asset alignment rather than broad international price weakness or evidence of generalized international capital withdrawal. Dollar strength and regional divergence coexisted with positive international-equity performance.
Structural Conclusion: Geographic price support remained broader than the evidence for synchronized global transmission.
PLMT — Post-Linear Market Structure
The PLMT regime remains Selective Synchronization Expansion. Large-cap momentum improved, short-horizon breadth repaired, and international equities remained constructive. At the same time, reserve conditions weakened, longer-horizon participation deteriorated, lower-quality credit widened, rates volatility increased, and aggregate equity ETF deployment became less supportive.
That configuration establishes neither broad synchronized expansion nor a coordinated defensive transition.
A defensive transition would require deterioration to converge across independent domains: broader credit impairment, persistently adverse positioning, deteriorating capital availability, weaker global transmission, and verified withdrawal across underlying risk exposures.
A transition toward broader expansion would require sustained participation repair across horizons and capitalization tiers, accompanied by supportive liquidity, credit, deployment, and geographic confirmation.
Neither transition is established.
Structural Conclusion: Selective Synchronization Expansion persists because support and deterioration have not converged into a uniform system-wide state.
What information did the system gain this week?
September 18 established that participation could deteriorate while volatility eased and selective deployment strengthened.
September 25 changed that configuration. Headline momentum and immediate breadth improved while observable equity deployment weakened and pressure increased in rates, reserve liquidity, and lower-quality credit.
The new information is the change in the sources of support—not evidence that stronger prices necessarily precede broader institutional repair.
Structural Conclusion: An equity advance can coexist with deterioration in several conditions that previously supported the market.
Three Hidden-State Discoveries
1. Immediate participation improved without sustained-trend confirmation. Twenty-day breadth and daily advancer/decliner participation strengthened, while 50-day and 200-day breadth weakened and equal-weight and small-cap exposures lagged. Sustained improvement at longer horizons would challenge this diagnosis. Structural Conclusion: The repair was observable but concentrated in the shortest participation layer.
2. Stronger headline prices lacked equivalent confirmation from observable ETF deployment. The S&P 500 and Nasdaq advanced while matched aggregate equity ETF flows shifted from strong inflows to net outflows; fixed-income flows remained positive. Concentration and incomplete basket coverage constrain conclusions about persistence. Structural Conclusion: Price strength and observable ETF deployment delivered different information without establishing direct migration from equities into bonds.
3. Rates and lower-quality credit weakened without an equivalent broad-equity volatility response. Real yields increased, CCC spreads widened, and MOVE rose approximately 19%, while VIX remained near 15 and the equity implied-volatility structure remained orderly. Structural Conclusion: Adverse repricing was concentrated outside broad equity implied volatility rather than absent from the system.
What did VMSI™ discover that price alone did not reveal?
Headline indexes showed a stronger equity market. They did not show the full institutional structure supporting it.
Price alone did not distinguish short-horizon participation repair from longer-horizon deterioration. It did not reveal weaker weekly-average reserve conditions, the concentration of credit deterioration below investment grade, the real-yield composition of the Treasury repricing, or the divergence between stronger equity prices and weaker aggregate ETF deployment.
VMSI™ places those observations within a common structural assessment while preserving their different measurement conventions.
Structural Conclusion: Stronger benchmark performance did not establish an equivalent improvement in the conditions supporting participation and capital deployment.
Earnings Topline
No earnings-specific transmission finding is advanced this week. Earnings remained contextual rather than a substitute for evidence on participation, liquidity, credit, positioning, deployment, or cross-asset transmission.
The absence of a separate system-level finding should not be interpreted as evidence that earnings were immaterial to individual securities.
Institutional Capital Migration Index™
Component
Score
Weekly Change
Trend
Interpretation
ETF Capital Flows
52.5
−3.0
Deteriorating
Matched aggregate equity flows weakened while fixed-income flows remained positive.
Dealer Positioning
53.0
+3.0
Improving
Modeled positioning ended the week in a more supportive gamma configuration; confidence in precise magnitude remains limited.
Liquidity Footprint
50.4
−1.8
Deteriorating
Weekly-average reserve conditions weakened despite an opposing Wednesday-endpoint signal.
Credit Market Confirmation
58.0
−2.7
Deteriorating
High-yield and CCC spreads widened while investment-grade spreads remained comparatively contained.
Cross-Asset Confirmation
54.8
−0.7
Mixed / weakening
Equity strength coexisted with adverse duration, lower-quality credit, and participation evidence.
ICMI™ Composite
53.7
−1.1
Deteriorating
Capital migration weakened but remained within the framework’s mixed or neutral state.
The five ICMI™ components retain the locked equal-weight methodology. The Composite remains within the framework’s mixed or neutral migration state, not broad accumulation or broad distribution.
Institutional Capital Forensics™
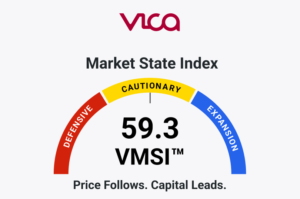
ICMI™ declined to 53.7 from 54.8, while the VMSI™ Composite declined to 58.4 from 59.3. Four ICMI™ components weakened. Dealer Positioning was the sole positive contribution and remains the component with the greatest model-based qualification.
The most important migration observation was the divergence between stronger equity prices and weaker aggregate equity ETF deployment. That evidence does not establish direct migration from equities into bonds or identify the investors responsible. It does establish a less-supportive observable deployment profile for equity risk.
Agreement between VMSI™ and ICMI™ direction is also not treated as independent confirmation where underlying evidence overlaps.
ICMI™ Confirmation: Capital migration weakened and did not confirm the full strength of headline equity performance.
Structural Conclusion: Capital-forensics evidence supports a narrower conclusion about observable deployment than about institutional behavior as a whole.
Final Institutional Assessment
The institutional system remains supported but unevenly synchronized. VMSI™ at 58.4 records modest further deterioration in the overall state, while Momentum improved to 60.0 as large-cap and growth equities strengthened.
That improvement did not extend through the full structure. Immediate breadth repaired while longer-horizon participation weakened. Reserve conditions became less supportive. Lower-quality credit deteriorated. Rates volatility increased. At the same time, investment-grade credit remained comparatively contained and international equities remained constructive.
IC-VMSI™ at 65.8 records weaker observable deployment, while ICMI™ at 53.7 records weaker capital migration without reaching a broad distribution state. Both interpretations remain bounded by their measurement windows and evidence coverage.
The strongest constructive evidence was stronger large-cap momentum, near-term breadth repair, contained investment-grade credit, positive fixed-income ETF flows, constructive international equities, and supportive modeled dealer positioning. The strongest adverse evidence was weaker reserve liquidity, higher real yields, lower-quality credit deterioration, narrow longer-horizon participation, and softer aggregate equity ETF deployment.
Current Regime: Selective Synchronization Expansion.
The decisive test is whether improvement extends beyond headline performance into sustained participation, credit, liquidity, and deployment confirmation—or whether deterioration broadens across independent domains.
Structural Conclusion: Price strength increased without establishing a comparably stronger institutional foundation.
About VMSI™
VMSI™ — VICA Market State Index is an observational institutional framework designed to identify changes in the conditions shaping market behavior.
Rather than interpreting indicators independently, VMSI™ evaluates relationships among participation, liquidity, credit, positioning, volatility, capital deployment, and global propagation.
Each weekly publication integrates observable evidence, proprietary relationship measures, and independent structural validation to assess the prevailing institutional market state.
Scientific Standard
Observations measure conditions. Relationships reveal information. Patterns reveal structure. Independent confirmation strengthens confidence in a signal. Contradictory evidence defines its limits.
Weekly evidence tests the framework’s implications; it does not prove the theory. Falsification conditions determine when an assessment must change.
IC-VMSI™ Definition
IC-VMSI™ measures institutional core capital-force and deployment behavior through observable allocation, creation-and-redemption activity, ownership structures, portfolio positioning, and benchmark-linked investment behavior.
The framework does not attempt to identify individual institutional trades. Price, momentum, trading volume, and price-driven AUM appreciation alone do not establish institutional capital deployment.
Underlying model construction remains proprietary to VICA Research.
Disclaimer / Trademark Notice
Disclaimer
VMSI™ is a proprietary observational market framework developed by VICA Research. This publication is provided for informational purposes only and does not constitute investment advice or a recommendation to buy or sell any security.
Conclusions reflect evidence-based interpretations of information available for the stated measurement period and may change as new evidence becomes available.
Trademark Notice
VMSI™, IC-VMSI™, ICMI™, Institutional Capital Migration Index™, Institutional Capital Forensics™, Market Mechanics, PLMT, PIR™, CQR™, HPR™, DFR™, GPR™, and associated framework names are trademarks of VICA Research.
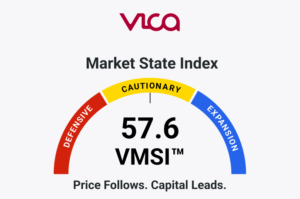
Participation Repaired. Credit Dispersion Persisted. The VMSI™ Composite increased to 57.6, with IC-VMSI™ at 64.9 and the Institutional Capital Migration...
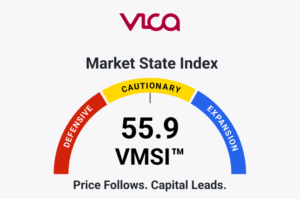
Price Held. Institutional Support Weakened. The VMSI™ Composite declined to 55.9. Headline equity performance remained comparatively resilient, but participation weakened,...
Participation deteriorated across short-, intermediate-, and long-horizon breadth. Volatility conditions improved, while provisional capital-flow evidence supported a stronger—but still selective—deployment...