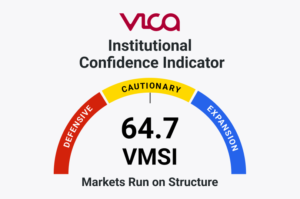
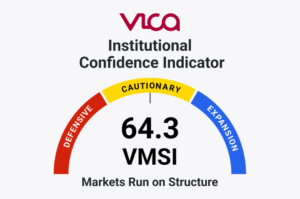
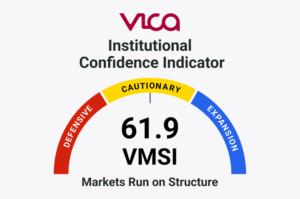
Institutional market conditions improved marginally as large-cap and global equities recovered and equity-volatility pressure declined. The VMSI™ Composite increased to 62.1 from 61.9.
Price recovery exceeded participation repair. The S&P 500, Nasdaq Composite, and Dow advanced, but small caps were essentially unchanged, equal weight underperformed capitalization-weighted exposure, and short- and intermediate-horizon breadth weakened.
Operational liquidity contracted for a second consecutive week as the Treasury General Account increased and reserve balances declined. Long-duration Treasuries weakened, rates volatility increased, and high-yield spreads widened modestly. Corporate credit nevertheless remained functional.
The PLMT regime remains Selective Synchronization Expansion. Institutional capital remained deployed, but synchronization was constrained by tighter liquidity, narrower domestic participation, and persistent duration pressure.
Large-cap and global equity recovery and lower equity-volatility pressure narrowly outweighed continued reserve-liquidity contraction, Treasury-duration stress, and weaker participation integrity. The score reconciles exactly with the locked component weights.
Momentum
65.5
66.5
+1.0
SPX rose 1.05%, the Nasdaq Composite 1.59%, and the Dow 1.04%. The increase is limited because IWM was essentially unchanged, RSP lagged SPY, and 20-day and 50-day breadth weakened.
Liquidity
60.0
57.5
−2.5
Average reserve balances declined $77.6 billion as the TGA increased $81.2 billion. Wednesday reserves fell $120.4 billion, long-duration Treasuries weakened, and MOVE rose. Lower reverse repos and functional credit prevented a larger reduction.
Volatility & Hedging
57.6
59.1
+1.5
VIX, VVIX, VXN, SKEW, CPCE, and CPCI declined, materially improving equity-risk conditions. MOVE increased 8.07%, however, and no matched dealer-gamma comparison was available.
Safe Haven Demand
49.7
48.8
−0.9
The dollar weakened, gold was essentially unchanged, and long-duration Treasuries declined. Modest short-duration Treasury strength did not establish synchronized defensive allocation.
Advanced Framework Layer Table
Advanced Framework
July 24
July 31 Final
Weekly Change
Institutional Comment
SPI
67.5
65.8
−1.7
Lower 20-day and 50-day breadth, negative daily exchange breadth, declining PIR™, equal-weight underperformance, and flat small-cap performance outweighed stronger 200-day participation. Longer-term structure remained intact.
CMX
57.2
58.2
+1.0
Equity volatility, volatility-of-volatility, tail pricing, and put demand declined. Rising MOVE and continued long-duration instability prevented a larger improvement. Unverified gamma estimates were excluded.
PDCS
68.6
66.5
−2.1
Deployment capacity weakened through a second reserve-liquidity withdrawal, higher TGA balances, duration rejection, modest high-yield spread widening, and unavailable matched flow confirmation. Functional credit and global equity participation limited the decline.
GFP
64.0
65.6
+1.6
Developed and emerging markets, Japan, China, EAFE, and broad international exposure advanced as the dollar weakened. Propagation improved but remained regionally differentiated rather than fully synchronized.
PLMT
Selective Synchronization Expansion
Selective Synchronization Expansion
No change
Global and large-cap participation improved while domestic breadth, operational liquidity, and duration conditions weakened. Credit remained orderly and institutional capital remained inside the system.
IC-VMSI™
66.4
66.4
+0.0
Broad beta and international equity prices improved, but tighter liquidity and unavailable matched creation-and-redemption data prevented price recovery from being treated as independently verified institutional deployment.
Executive Summary
The VMSI™ Composite increased to 62.1 from 61.9. Momentum rose to 66.5, and Volatility & Hedging improved to 59.1. Liquidity declined to 57.5, while Safe Haven Demand fell to 48.8.
The positive impulse came from large-cap and international equity recovery. The S&P 500 gained 1.05%, the Nasdaq Composite advanced 1.59%, and the Dow rose 1.04%. Developed and emerging international markets also strengthened as the dollar declined.
Participation did not confirm the full magnitude of the price advance. IWM was essentially unchanged, RSP underperformed SPY, and the Participation Integrity Ratio declined 0.42%. The percentages of S&P 500 constituents above their 20-day and 50-day moving averages also weakened, while 200-day participation improved modestly.
Liquidity remained the principal constraint. Average reserve balances declined approximately $77.6 billion as the Treasury General Account increased approximately $81.2 billion. Federal Reserve assets changed only modestly, indicating that Treasury cash mechanics—not broad monetary contraction—remained the primary withdrawal mechanism.
Equity-risk pricing improved materially, but rates risk moved in the opposite direction. VIX, VVIX, VXN, SKEW, and put/call ratios declined, while MOVE increased and long-duration Treasuries weakened.
ICMI™ declined to 51.2 from 51.6. More supportive equity positioning and stronger international participation were outweighed by a weaker liquidity footprint, modest high-yield spread widening, and absent ETF-flow confirmation.
Structural Conclusion: Institutional conditions improved marginally, but price strength was not fully confirmed by participation, liquidity, duration, or independently verified capital flows.
Market Structure
The S&P 500 advanced 1.05%, the Nasdaq Composite gained 1.59%, and the Dow rose 1.04%. IWM increased only 0.01%, showing that the large-cap recovery did not extend uniformly into smaller companies.
Equal-weight participation also lagged. RSP advanced 0.67%, compared with a 1.10% gain in SPY. The Participation Integrity Ratio—RSP divided by SPY—declined from 0.28903 to 0.28782, a weekly decrease of approximately 0.42%.
Breadth weakened at shorter horizons. Approximately 53.28% of S&P 500 constituents remained above their 20-day moving averages, down 1.78 percentage points. The percentage above the 50-day average declined 3.18 points to 62.02%.
Longer-term participation remained more stable. The percentage above the 200-day moving average increased 0.80 point to 66.60%. New-high and new-low observations differed across exchange and broader-market universes and were therefore treated as secondary rather than score-determining evidence.
Factor signals were not uniform across index families. VUG gained 2.06% while VTV declined 0.48%. IWD advanced 1.44%, however, compared with a 0.57% increase in IWF. The divergence reduced confidence in declaring a system-wide growth or value rotation.
SPI declined to 65.8. The reduction reflects weaker near-term participation and declining equal-weight confirmation, not a failure of the longer-term market structure.
Structural Conclusion: Capitalization-weighted indexes recovered, but equal weight, small caps, and shorter-horizon breadth showed that participation remained narrower than headline performance implied.
Credit & Liquidity Conditions
Corporate credit weakened modestly but remained functional.
High-yield OAS widened from 279 basis points on July 24 to 284 basis points on July 30, the latest available observation. Investment-grade OAS remained unchanged at 80 basis points. Over approximately one month, high-yield spreads widened nine basis points, while investment-grade spreads widened four basis points.
Credit ETF behavior remained orderly. HYG gained 0.32%, SJNK advanced 0.24%, and LQD increased 0.02%. The Credit Quality Ratio declined from 1.34078 to 1.33681, approximately 0.30%, as high yield outperformed duration-sensitive investment grade.
Treasury performance followed a clear maturity gradient. SHY gained 0.18%, and IEI advanced 0.13%. IEF declined 0.09%, while TLT fell 1.20%, EDV lost 2.33%, and ZROZ declined 2.81%.
The widening losses across maturity and convexity reflected continued rejection of long-duration exposure. Investors maintained short-duration liquidity while reducing sensitivity to long-term rates and term-premium risk.
Federal Reserve liquidity conditions deteriorated further. Average reserve balances declined approximately $77.6 billion as the Treasury General Account increased approximately $81.2 billion. Reverse-repurchase balances declined approximately $9.3 billion, partially offsetting the Treasury cash withdrawal.
Wednesday point-in-time readings showed a sharper month-end effect. Reserve balances declined approximately $120.4 billion, while the Treasury General Account increased approximately $135.0 billion. Federal Reserve total assets declined only approximately $9.2 billion.
Liquidity declined to 57.5, while the ICMI™ Liquidity Footprint fell to 49.0.
Structural Conclusion: Treasury cash accumulation tightened operational liquidity and amplified duration pressure, while orderly corporate credit continued to separate rates repricing from systemic financing stress.
Positioning & Convexity
Equity-volatility conditions improved materially.
VIX declined 13.94% to 15.99. VVIX fell 9.02% to 91.64, and VXN declined 8.42% to 26.00. SKEW fell 4.11% to 141.23, indicating lower tail-risk pricing, although the absolute reading remained elevated.
Daily Cboe options data confirmed lower immediate protection demand. CPCE declined from 0.79 to 0.63, while CPCI declined from 1.08 to 1.01. Cboe’s July 31 underlying volumes independently reconcile to the reported ratios.
The Hedging Preference Ratio declined from 0.73148 to 0.62376, approximately 14.73%. Equity put demand declined more rapidly than index put demand, indicating that the remaining protection profile continued to favor broader portfolio hedging.
Rates volatility diverged sharply. MOVE increased 8.07% to 83.02 as long-duration Treasury exposure weakened. The increase limited the degree to which lower equity volatility could be interpreted as broad cross-asset normalization.
No matched July 24 and July 31 dealer-gamma series from the same vendor and methodology was available. Dealer positioning was therefore evaluated through observable options and volatility evidence rather than an unsupported gamma comparison.
CMX increased to 58.2, and Volatility & Hedging rose to 59.1.
Structural Conclusion: Equity convexity conditions improved as immediate hedging pressure declined, but higher rates volatility and persistent duration instability prevented full positioning normalization.
Flow & Allocation Behavior
Allocation behavior remained selective, but weekly capital-flow visibility remained incomplete.
Exact July 27–31 equity, bond, and sector ETF creation-and-redemption totals were not available by the report cutoff. The latest complete ICI release covered the week ended July 22 and could not be substituted for the July 31 reporting period. The Deployment Force Ratio therefore remained unavailable.
Price behavior was consistent with selective risk re-engagement. Broad U.S. equity exposure, large-cap growth, developed international markets, emerging markets, Japan, and China advanced. Corporate credit also remained stable.
Price movement alone, however, does not establish institutional accumulation. The absence of matched creation-and-redemption data prevented the framework from treating the equity recovery as independently confirmed capital deployment.
PDCS declined to 66.5 as reserve liquidity contracted, duration pressure increased, high-yield spreads widened modestly, and flow confirmation remained unavailable.
IC-VMSI™ remained unchanged at 66.4. The stable score recognizes that institutional capital remained inside the market system while withholding additional confirmation that observable flow evidence did not support.
Orderly credit and improving global participation limited the deterioration. Broader deployment would require stronger participation integrity, recovering liquidity, and confirmed capital-flow transmission.
Structural Conclusion: Institutional capital remained deployable, but tighter liquidity and incomplete flow confirmation prevented price recovery from becoming a broader accumulation signal.
Global Propagation Conditions
Global equity participation improved.
VEA advanced 1.31%, while VWO gained 1.64%. The Global Propagation Ratio declined from 1.20606 to 1.20204, approximately 0.33%, because emerging markets modestly outperformed developed markets.
EEM gained 1.20%, IEMG advanced 0.73%, and EFA rose 2.10%. VXUS increased 1.43%, while ACWI gained 1.38%.
Regional performance was constructive. EWJ advanced 1.29%, and FXI gained 5.55%. China produced the strongest move among the regional exposures measured, while Japan and broader developed markets also participated.
The dollar index declined 1.53% to 99.91, reducing a constraint on international and emerging-market assets. Gold declined 0.10%, providing no evidence of a synchronized defensive flight. VNQ fell 1.85%, consistent with continued rate sensitivity, while BNDX declined 0.06%.
Matched WTI and Brent observations were excluded because the July 24 and July 31 contract and settlement conventions could not be independently aligned.
GFP increased to 65.6. The score recognizes broader international participation but stops short of classifying the move as fully synchronized global expansion.
Structural Conclusion: Global propagation strengthened as the dollar weakened and developed and emerging markets advanced, but regional differentiation and continued duration pressure kept synchronization selective.
Advanced Signal Layer
The Advanced Framework remained divided between stronger global propagation and weaker domestic participation and deployment capacity.
SPI declined to 65.8 as weaker short- and intermediate-horizon breadth, small-cap stagnation, and declining PIR™ outweighed stronger 200-day participation.
CMX increased to 58.2 as equity volatility, volatility-of-volatility, tail pricing, and put demand declined. Higher MOVE and long-duration Treasury weakness limited the improvement.
PDCS declined to 66.5 as reserve balances contracted, Treasury cash accumulation increased, duration weakened, high-yield spreads widened modestly, and weekly capital-flow visibility remained incomplete.
GFP increased to 65.6 as developed and emerging markets advanced and the dollar weakened.
IC-VMSI™ remained unchanged at 66.4. Institutional capital remained deployed, but the framework did not infer additional accumulation from price and volume alone.
The relationship metrics confirmed the same organization. PIR™ identified weaker equal-weight participation. CQR™ separated duration-sensitive investment-grade behavior from high-yield stress. HPR™ identified lower absolute hedging with continued index orientation. GPR™ reflected emerging-market outperformance. DFR™ remained unavailable.
The combined evidence continues to support Selective Synchronization Expansion.
Structural Conclusion: Institutional coordination improved across global risk assets and equity positioning but weakened through domestic participation, operational liquidity, and duration-sensitive deployment channels.
Structural Discoveries
Price recovery did not represent complete participation repair. Large-cap indexes advanced, but equal-weight exposure lagged, small caps were unchanged, and shorter-horizon breadth deteriorated.
Liquidity remained the principal adverse system mechanism. Reserve balances contracted as Treasury cash balances increased, while Federal Reserve assets changed only modestly.
Equity and rates volatility moved in opposite directions. Immediate equity hedging pressure declined, but MOVE increased and long-duration Treasury losses intensified.
Credit continued to distinguish duration pressure from financing stress. High-yield spreads widened modestly, but HYG and SJNK remained orderly and investment-grade spreads were unchanged.
Earnings held; capital distinguished durability from headline beats.
Structural Conclusion: The hidden structure was defined by stronger equity prices, incomplete participation, tighter operational liquidity, improving equity convexity, elevated rates risk, and functional credit.
Institutional Capital Migration Index™
Institutional Capital Migration Dashboard™
ICMI™ Component
July 24
July 31 Final
Weekly Change
Trend
Confidence
Interpretation
ETF Capital Flows
48.0
48.0
+0.0
Unconfirmed
Low
Complete matched July 27–31 equity, bond, and sector ETF totals were unavailable. No price, volume, or partial-period substitute was used.
Dealer Positioning
47.0
49.0
+2.0
More supportive
Medium-low
CPCE and CPCI declined materially, and the equity-volatility complex eased. The score remains below neutral because no matched same-vendor gamma comparison was verified.
Liquidity Footprint
54.0
49.0
−5.0
Deteriorating
High
Average reserves declined $77.6 billion and Wednesday reserves declined $120.4 billion as TGA balances rose sharply. Lower reverse repos provided only a partial offset.
Credit Market Confirmation
59.0
58.0
−1.0
Slightly weaker
High
High-yield OAS widened five basis points while investment-grade OAS remained flat. HYG and SJNK remained orderly, separating modest spread deterioration from systemic credit stress.
Cross-Asset Confirmation
50.0
52.0
+2.0
Constructive but mixed
Medium-high
U.S. large caps and international equities advanced, the dollar weakened, and credit remained functional. Small caps, breadth, and long-duration Treasuries did not provide equivalent confirmation.
Institutional Capital Migration Index™
51.6
51.2
−0.4
Mixed; marginally more defensive
Medium
Better equity positioning and global participation were more than offset by a weaker liquidity footprint, modest high-yield spread widening, and absent ETF-flow confirmation.
Institutional Capital Forensics™
ICMI™ declined to 51.2 from 51.6, leaving institutional migration in mixed or neutral territory. The movement did not indicate broad distribution; it showed that improved equity positioning and global participation were insufficient to offset a weaker liquidity footprint.
Liquidity was the dominant negative input. Average reserve balances fell approximately $77.6 billion as the Treasury General Account rose approximately $81.2 billion, moving the Liquidity Footprint from 54.0 to 49.0. Dealer Positioning improved to 49.0 as equity and index put/call ratios declined and the equity-volatility complex eased, but the absence of a matched same-vendor gamma series limited confidence.
Credit weakened only at the margin. High-yield OAS widened five basis points, investment-grade OAS was unchanged, and HYG and SJNK advanced. Credit therefore did not confirm forced liquidation or systemic financing stress.
Cross-Asset Confirmation improved to 52.0 as U.S. large-cap and international equities advanced and the dollar weakened. Flat small-cap performance, weaker breadth, higher MOVE, and losses in long-duration Treasuries limited that confirmation. ETF Capital Flows remained at 48.0 with low confidence because complete matched weekly totals were unavailable.
ICMI™ Confirmation: ICMI™ confirms that institutional capital remained inside the financial system but became marginally more defensive as liquidity deterioration outweighed improved equity positioning and global participation.
Structural Conclusion: Institutional migration remained mixed, with selective risk deployment occurring alongside tighter liquidity, duration rejection, and incomplete flow confirmation.
Final Institutional Assessment
The independent evidence converged on a marginal improvement in the institutional market state. The VMSI™ Composite increased to 62.1 as large-cap and global equity prices recovered and immediate equity-volatility pressure declined.
The improvement was narrow. Equal-weight exposure lagged capitalization-weighted benchmarks, small caps were essentially unchanged, and short- and intermediate-horizon breadth weakened. Longer-term participation remained intact, preventing the narrowing from becoming a broader structural deterioration.
Liquidity weakened for a second consecutive week. Treasury cash accumulation reduced reserve balances, while long-duration Treasuries declined and MOVE increased. The mechanism remained operational rather than the result of substantial Federal Reserve balance-sheet contraction.
Credit remained functional. High-yield spreads widened modestly, investment-grade spreads were unchanged, and credit ETFs showed no evidence of disorderly liquidation. Rates pressure continued to exceed corporate-financing stress.
Positioning improved within equities. VIX, VVIX, VXN, SKEW, CPCE, and CPCI declined. Rates volatility moved in the opposite direction, preserving a divided convexity structure.
Global participation strengthened as developed and emerging markets advanced and the dollar weakened. The improvement broadened geographic transmission but did not resolve weaker domestic participation or duration sensitivity.
ICMI™ declined slightly to 51.2, confirming that institutional capital remained deployed but became marginally more defensive as the liquidity footprint deteriorated. The absence of matched ETF-flow data prevented stronger accumulation or distribution conclusions.
The regime therefore remains Selective Synchronization Expansion. Institutional capital continues to operate within the market system, but deployment remains selective, liquidity-sensitive, and uneven across participation and duration channels.
ICMI™ Confirmation: ICMI™ confirms continued institutional deployment within a mixed migration environment, with stronger equity positioning and global participation offset by weaker liquidity and incomplete flow confirmation.
Structural Conclusion: Institutional market organization improved marginally, but participation lagged price, liquidity contracted, and rates risk remained elevated. Orderly credit and broader global participation preserved the underlying structure.
Regime Assessment: The institutional market regime remains Selective Synchronization Expansion, characterized by selective capital deployment, improving equity-risk conditions, stronger global propagation, tighter operational liquidity, incomplete domestic participation, and persistent duration sensitivity.
About VMSI™
The VICA Institutional Market Sentiment Index (VMSI™) is an observational market framework that measures the institutional conditions shaping market behavior before those conditions become fully reflected in prices.
Rather than analyzing individual indicators in isolation, VMSI™ measures the relationships among participation, liquidity, credit, positioning, capital deployment, and global propagation to identify the underlying organization of institutional markets.
Each weekly publication integrates observable market data, proprietary relationship metrics, and independent structural validation to estimate the current institutional market regime.
IC-VMSI™—Institutional Capital VMSI—measures institutional capital deployment through ownership, allocation, portfolio positioning, and benchmark-linked investment behavior.
The framework estimates institutional capital deployment across markets using observable evidence rather than individual trade reporting.
Disclaimer
VMSI™ is a proprietary observational market framework developed by VICA Research. This publication is provided for informational purposes only and does not constitute investment advice or a recommendation to buy or sell any security.
Conclusions reflect evidence-based interpretations of available market information at the time of publication and may change as new evidence becomes available.
Trademark Notice
VMSI™, IC-VMSI™, ICMI™, Institutional Capital Migration Index™, Institutional Capital Forensics™, and associated framework names are trademarks of VICA Research.
VICA Partners Research Institutional participation broadened as small caps, equal weight, medium-term breadth, and global equity transmission strengthened while surface...
Opening Summary Institutional market conditions weakened as reserve liquidity contracted, US equity momentum softened, and Treasury-duration pressure increased. The VMSI™...