Institutional market conditions strengthened as participation broadened, credit tightened, duration stabilized, liquidity improved, and equity and rates volatility compressed together. Direct capital-flow confirmation remained incomplete as equal weight lagged capitalization-weighted leadership and matched ETF creation-and-redemption data remained unavailable.
Participation, credit, liquidity, duration, volatility, and global transmission improved together, while direct ETF-flow confirmation remained unavailable.
Momentum
66.5
69.2
+2.7
Major indexes, small caps, and all three breadth horizons strengthened, although equal weight continued to lag capitalization-weighted leadership.
Liquidity
57.5
59.0
+1.5
Reserve conditions improved as Treasury cash pressure eased, but part of the repair reflected reversal of month-end cash mechanics.
Volatility & Hedging
59.1
62.1
+3.0
Equity and rates volatility compressed together as immediate protection demand declined, while residual hedging remained more index-oriented.
Safe Haven Demand
48.8
50.4
+1.6
Gold and long-duration Treasuries strengthened, but concurrent equity and credit gains prevented confirmation of a broad defensive rotation.
Participation broadened across all measured horizons and small caps strengthened, while capitalization-weighted leadership continued to outperform equal weight.
CMX
58.2
61.2
+3.0
Equity, rates, tail-risk, and volatility-of-volatility measures compressed together, materially reducing convexity pressure while exact dealer-gamma precision remained unavailable.
PDCS
66.5
68.8
+2.3
Credit, liquidity, duration, participation, and positioning strengthened deployment capacity before matched capital-flow evidence became available.
GFP
65.6
67.2
+1.6
Developed and emerging markets advanced together, while China weakness and strong gold demand prevented uniform global synchronization.
IC-VMSI™
66.4
67.2
+0.8
Core institutional structures strengthened across equity, credit, duration, and international exposures, while absent matched fund flows limited accumulation confirmation.
Indicator
July 31 Regime
August 7 Regime
Change
Institutional State
PLMT
Selective Synchronization Expansion
Selective Synchronization Expansion
No change
Synchronization strengthened across more transmission channels, but concentration, regional asymmetry, and incomplete flow evidence prevented broad participation expansion.
CMX: Convexity compression remained incomplete. PDCS: Deployment broadened selectively. GFP: Global propagation stabilized. PLMT: Structural compression eased.
Signal Integrity
Confirmed: Index performance, S&P 500 moving-average breadth, credit spreads, credit ETFs, Treasury duration, volatility complex, Cboe put/call ratios, Federal Reserve liquidity data, and broad global-market transmission.
Provisional: Exchange advancer-decliner and new-high/new-low observations; dealer-gamma regime evidence where exact matched same-vendor positioning levels were unavailable.
Unavailable: PIR™, DFR™, matched August 3–7 ETF creation-and-redemption totals, exact Net GEX, and exact Gamma Flip / Zero Gamma.
Evidence Rule: Observed data determine state. Inference may refine interpretation. Missing evidence is never replaced by price action.
Executive Summary
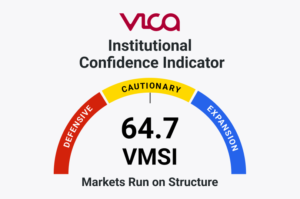
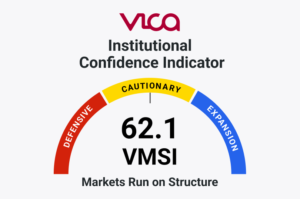
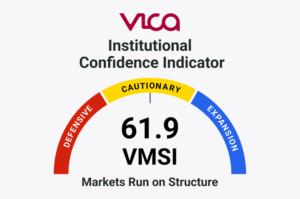
The VMSI™ Composite increased to 64.3 from 62.1 as institutional conditions strengthened across a wider set of market channels. Momentum rose to 69.2, Liquidity to 59.0, Volatility & Hedging to 62.1, and Safe Haven Demand to 50.4.
Six independently observable transmission channels improved concurrently: participation, credit, liquidity, duration, convexity, and global propagation. Small caps rejoined the advance, breadth strengthened across all three measured horizons, credit spreads tightened, long-duration Treasuries recovered, reserve liquidity improved modestly, and equity and rates volatility compressed together.
The contradiction remains concentration and incomplete flow confirmation. Equal weight continued to lag capitalization-weighted exposure, growth remained dominant, China diverged from broader global strength, and matched ETF-flow data remained unavailable. The improved state would lose confirmation if breadth narrowed while credit, liquidity, and convexity deteriorated together.
Structural Conclusion: The institutional system synchronized across more channels than direct capital-flow evidence could confirm.
Market Structure
Domestic structure strengthened as the advance broadened beyond large-cap leadership. The S&P 500 rose 3.58%, the Nasdaq Composite gained 5.19%, the Dow advanced 2.96%, and IWM increased 3.56%.
Breadth independently confirmed the repair. Approximately 65.20% of S&P 500 constituents were above their 20-day moving averages, up 11.92 percentage points; 65.60% were above their 50-day averages, up 3.58 points; and 72.76% were above their 200-day averages, up 6.16 points.
Leadership nevertheless remained hierarchical. RSP gained 2.36%, below the S&P 500’s advance, while VUG gained 4.93% versus 1.98% for VTV. IWF similarly outperformed IWD. This interpretation would weaken if equal weight and smaller-cap participation again separated materially from headline indexes.
Structural Conclusion: Participation broadened faster than leadership diversified.
Credit & Liquidity Conditions
Credit moved from merely functional to actively supportive. Through the latest matched observation, high-yield OAS tightened 13 basis points to 271 basis points, while investment-grade OAS tightened two basis points to 78 basis points.
HYG, LQD, SJNK, and EMB remained orderly, while CQR™ increased modestly to 1.33840. Treasury performance improved progressively with maturity: TLT, EDV, and ZROZ recovered after the previous week’s duration rejection.
Average reserve balances increased approximately $8.8 billion as the average Treasury General Account declined approximately $3.5 billion and reverse repos eased approximately $1.2 billion. The larger Wednesday improvement partly reversed month-end Treasury cash accumulation and was not treated as broad monetary expansion. Confirmation would weaken if reserves contracted again alongside wider credit spreads and renewed duration rejection.
Structural Conclusion: Credit improved faster than monetary liquidity, while Treasury cash mechanics removed an important transmission constraint.
Positioning & Convexity
Positioning improved across equity and fixed-income volatility channels. Unlike the previous week, lower equity-risk pricing was reinforced rather than contradicted by rates volatility.
VIX, VVIX, VXN, SKEW, and MOVE declined together. CPCE fell to 0.54, while CPCI declined to 0.98. HPR™ fell from 0.62376 to 0.55102, approximately 11.66%, as equity protection demand normalized faster than index-level hedging.
Vendor-model evidence indicated a more stabilizing positive-gamma environment late in the week, but exact same-vendor Net GEX and Gamma Flip observations were unavailable. The convexity signal would weaken if volatility-of-volatility, tail pricing, rates volatility, and put demand re-expanded simultaneously.
Conditions governing institutional deployment improved even though direct weekly flow visibility remained incomplete. More asset classes participated, and fewer transmission channels resisted capital deployment.
Broad U.S. equities, small caps, growth, value, corporate credit, developed markets, emerging markets, and duration all strengthened. Tighter credit, lower volatility, improved reserve conditions, and broader participation created a more favorable deployment environment.
Matched August 3–7 equity, bond, sector, and IC-VMSI™ fund-universe flows were unavailable under the required reporting convention. DFR™ therefore remains Unavailable, and no flow estimate is inferred from price, volume, momentum, moving averages, or AUM appreciation. The deployment interpretation would weaken if these enabling conditions deteriorated before direct flows confirmed accumulation.
Structural Conclusion: Deployment conditions improved faster than flow visibility.
Structural Participation Integrity
Structural Participation Integrity improved as breadth and small-cap participation strengthened together. The repair was materially broader than the previous week’s capitalization-led recovery.
Participation above the 20-day, 50-day, and 200-day moving averages increased across all three horizons, while IWM advanced 3.56%. Available exchange breadth was directionally positive, although closing advancer-decliner and new-high/new-low observations remained provisional.
Participation was broader but not fully redundant. Equal weight remained behind capitalization-weighted exposure, growth materially outperformed value, and exact PIR™ could not be finalized without matched RSP and SPY observations. SPI confirmation would weaken if shorter-horizon breadth and small-cap participation reversed while concentrated leadership persisted.
Structural Conclusion: Breadth improved without eliminating concentration dependency.
Global Propagation Conditions
Global propagation strengthened alongside domestic participation. The expansion extended across developed, emerging, and broad international equity structures.
VEA gained 3.21%, VWO advanced 2.93%, IEMG rose 3.07%, EFA gained 2.81%, VXUS increased 3.10%, and ACWI advanced 3.20%. GPR™ increased from 1.20204 to 1.20539, approximately 0.28%, reflecting modest developed-market outperformance.
Japan strengthened materially while China remained the principal regional exception. The dollar weakened modestly, but gold advanced sharply and VNQ lagged. Global confirmation would weaken if regional participation fragmented while dollar strength reintroduced pressure on international and emerging-market transmission.
Structural Conclusion: Global propagation broadened without becoming uniform.
Advanced Signal Layer
The Advanced Framework confirms that August 7 was not simply a higher-price event. SPI increased to 68.2, CMX to 61.2, PDCS to 68.8, GFP to 67.2, and IC-VMSI™ to 67.2.
CQR™ improved modestly, HPR™ declined materially, and GPR™ strengthened. DFR™ remained unavailable because matched weekly equity and bond ETF flows could not be verified. PIR™ also remained unavailable under the required matched-observation standard.
The interaction matters more than any isolated score. Broader breadth reduced participation fragility; lower volatility reduced convexity friction; tighter credit improved financing confirmation; and international gains expanded transmission beyond U.S. large caps. This interpretation would weaken if these signals began diverging rather than reinforcing one another.
Structural Conclusion: Institutional force vectors aligned faster than the observable flow ledger.
CMX — Convexity Metrics Index
CMX increased to 61.2 from 58.2 as volatility became more coherent across asset classes. The improvement extended beyond spot VIX.
Equity volatility, volatility-of-volatility, Nasdaq volatility, tail pricing, rates volatility, equity put demand, and index put demand all declined. Multiple independent channels therefore confirmed lower convexity pressure.
Dealer positioning was directionally supportive but not precisely measurable under a matched same-vendor series. CMX would lose confirmation if volatility compression reversed across several independent channels rather than through a single-market shock.
Structural Conclusion: Convexity compression improved across the system but remained incomplete.
PDCS — Pre-Deployment Capital Signals
PDCS increased to 68.8 from 66.5 as the system presented fewer constraints on institutional deployment.
Credit tightened, duration recovered, liquidity improved modestly, participation broadened, and hedging pressure declined. These variables strengthened the transmission environment through which capital could be deployed.
Direct evidence of broad net accumulation remained unavailable. Matched creation-and-redemption data were absent, preventing DFR™ and weekly IC-VMSI™ fund-flow analysis from confirming the deployment impulse. PDCS confirmation would weaken if the enabling structure deteriorated before observable accumulation emerged.
Structural Conclusion: Deployment capacity strengthened before broad accumulation could be directly observed.
GFP — Global Propagation Framework
GFP increased to 67.2 from 65.6 as international transmission became more coherent with the U.S. advance.
Developed markets, emerging markets, Japan, broad international exposure, and global equity benchmarks advanced together. GPR™ increased modestly without material deterioration in emerging-market participation.
China remained an exception, while gold’s strength provided a defensive counter-signal. GFP would lose confirmation if regional differentiation widened enough to break the current developed-emerging transmission structure.
Structural Conclusion: Global synchronization strengthened despite persistent regional asymmetry.
PLMT — Post-Linear Market Structure
The PLMT regime remains Selective Synchronization Expansion. The regime did not change, but its internal organization improved.
Participation broadened, equity and rates volatility compressed together, credit tightened, duration stabilized, operational liquidity improved, and global propagation strengthened. More institutional force vectors moved in the same direction.
The regime does not yet qualify as Broad Participation Expansion. Equal weight lagged, growth remained dominant, China diverged, structural redundancy remained incomplete, and matched direct flow confirmation was unavailable. Selective Synchronization Expansion would lose confirmation if participation narrowed while credit, liquidity, convexity, and global transmission deteriorated concurrently.
Structural Conclusion: The system became more synchronized without becoming fully redundant.
Three Hidden-State Discoveries
1. Participation broadened faster than leadership diversified.
Small caps and all three measured breadth horizons strengthened, but equal weight still lagged capitalization-weighted performance and growth remained dominant.
2. Cross-asset convexity normalized before hedging architecture fully reset.
Equity volatility, rates volatility, tail pricing, volatility-of-volatility, and immediate protection demand compressed together, while residual hedging remained more index-oriented.
3. Deployment conditions improved faster than flow visibility.
Credit, liquidity, duration, positioning, participation, and global propagation strengthened, but matched ETF creation-and-redemption evidence remained unavailable.
What did VMSI™ discover this week that price alone did not reveal?
The market did more than rally: its transmission system synchronized before direct flow evidence caught up.
Earnings Topline
Earnings remained resilient; capital rewarded revenue quality over headline beats.
Institutional Capital Migration Index™
Institutional Capital Migration Dashboard™
Component
July 31
August 7
Weekly Change
Trend
Confidence
Institutional Interpretation
ETF Capital Flows
48.0
48.0
+0.0
►
Low
Matched creation-and-redemption data remained unavailable, preventing direct confirmation of broad accumulation or distribution.
Dealer Positioning
49.0
54.0
+5.0
▲
Medium
Lower protection demand and more stabilizing gamma conditions reduced mechanical downside sensitivity, while exact matched dealer levels remained unavailable.
Liquidity Footprint
49.0
53.0
+4.0
▲
High
Reserve balances improved as Treasury cash pressure eased, reversing part of the prior week’s operational liquidity contraction.
Credit Market Confirmation
58.0
63.0
+5.0
▲
High
High-yield and investment-grade spreads tightened while credit ETFs remained orderly, independently confirming improved risk transmission.
Cross-Asset Confirmation
52.0
57.0
+5.0
▲
Medium-High
Equities, small caps, duration, credit, and international markets increasingly aligned, while gold and China preserved cross-asset asymmetries.
Institutional Capital Migration Index™
51.2
55.0
+3.8
▲
Medium
Migration became more constructive as four components improved, but absent ETF-flow evidence prevented classification as broad accumulation.
The five ICMI™ components remain equally weighted at 20%. The August 7 composite reconciles to 55.0.
Institutional Capital Forensics™
ICMI™ increased to 55.0 from 51.2, moving institutional capital migration into a more constructive configuration without establishing broad accumulation. Dealer Positioning, Liquidity Footprint, Credit Market Confirmation, and Cross-Asset Confirmation all improved.
Credit provided the strongest independent confirmation. High-yield and investment-grade spreads tightened, credit ETFs remained orderly, reserves increased, Treasury cash pressure eased, and lower equity and rates volatility reduced positioning friction.
Cross-asset behavior increasingly supported the same state: U.S. equities, small caps, duration, corporate credit, developed markets, and emerging markets strengthened concurrently. Gold and China remained counter-signals, while ETF Capital Flows stayed at 48.0 with low confidence because matched August 3–7 creation-and-redemption totals were unavailable. The ICMI™ interpretation would weaken if credit, liquidity, dealer positioning, and cross-asset confirmation deteriorated together before flow evidence strengthened.
ICMI™ Confirmation: Capital migration became more constructive faster than direct capital-flow visibility.
Final Institutional Assessment
Institutional market organization strengthened during the week ending August 7. The VMSI™ Composite increased to 64.3 as participation broadened, cross-asset volatility compressed, credit tightened, duration pressure eased, operational liquidity improved modestly, and global propagation expanded.
The unresolved structure narrowed but did not disappear. Equal weight continued to trail capitalization-weighted exposure, growth remained dominant, gold strengthened alongside risk assets, China diverged from broader participation, and matched ETF-flow evidence remained unavailable. The state would lose confirmation if participation narrowed while credit, liquidity, convexity, and global transmission deteriorated concurrently.
Current Regime: Selective Synchronization Expansion. More institutional force vectors aligned simultaneously, but structural redundancy and direct accumulation confirmation remain incomplete. ICMI™ supports the improved VMSI™ state without yet confirming broad institutional accumulation.
The VICA Institutional Market Sentiment Index (VMSI™) is an observational market framework that measures institutional conditions shaping market behavior before those conditions become fully reflected in prices.
Rather than analyzing indicators in isolation, VMSI™ measures relationships among participation, liquidity, credit, positioning, capital deployment, and global propagation to identify the underlying organization of institutional markets.
Each weekly publication integrates observable market data, proprietary relationship metrics, and independent structural validation to estimate the current institutional market regime.
Scientific Standard
VMSI™ is an observational market framework.
Observations measure conditions.
Relationships reveal information.
Patterns reveal structure.
Independent confirmation validates the signal.
Contradictory evidence defines uncertainty.
Falsification conditions define when the state must be revised.
IC-VMSI™ measures the daily force of institutional core buying across passive and benchmark-linked fund structures, led by Vanguard and BlackRock fund-flow behavior.
The framework estimates institutional capital deployment through observable ownership, allocation, creation-and-redemption activity, portfolio positioning, and benchmark-linked investment behavior rather than attempting to identify individual institutional trades.
Disclaimer
VMSI™ is a proprietary observational market framework developed by VICA Research. This publication is provided for informational purposes only and does not constitute investment advice or a recommendation to buy or sell any security.
Conclusions reflect evidence-based interpretations of available market information at the time of publication and may change as new evidence becomes available.
Trademark Notice
VMSI™, IC-VMSI™, ICMI™, Institutional Capital Migration Index™, Institutional Capital Forensics™, and associated framework names are trademarks of VICA Research.
VICA Partners Research Institutional participation broadened as small caps, equal weight, medium-term breadth, and global equity transmission strengthened while surface...
Opening Summary Institutional market conditions improved marginally as large-cap and global equities recovered and equity-volatility pressure declined. The VMSI™ Composite...
Opening Summary Institutional market conditions weakened as reserve liquidity contracted, US equity momentum softened, and Treasury-duration pressure increased. The VMSI™...