VMSI™ | August 14, 2026 — Participation Broadened. Liquidity Contracted.
August 17, 2026
Matthew Krumholz
VICA Partners Research
Institutional participation broadened as small caps, equal weight, medium-term breadth, and global equity transmission strengthened while surface volatility compressed. Reserve liquidity contracted, long-duration Treasury confidence weakened, and protection demand remained elevated, preventing participation gains from becoming a broader structural upgrade.
Live Report: vicapartners.com
VMSI™ Snapshot
Indicator
Score
Weekly Change
Institutional State
VMSI™ Composite
64.7
+0.4
Participation improved; liquidity and hedging limited confirmation.
Momentum
70.8
+1.6
Breadth improved beneath concentration.
Liquidity
57.4
−1.6
Liquidity deteriorated faster than participation.
Volatility & Hedging
63.2
+1.1
Hedging demand remained elevated.
Safe Haven Demand
49.8
−0.6
Defensive positioning eased.
Advanced Framework Layer
Framework
Score
Weekly Change
Institutional State
SPI
70.3
+2.1
Participation broadened; long-duration redundancy remained incomplete.
CMX
62.0
+0.8
Convexity compression remained incomplete.
PDCS
69.8
+1.0
Deployment broadened selectively.
GFP
69.0
+1.8
Global propagation remained uneven.
IC-VMSI™
67.2
0.0
Core allocation remained selective; flow confirmation stayed incomplete.
PLMT
—
—
Structural compression eased.
Signal Integrity
Confirmed evidence includes U.S. index performance, moving-average breadth, advancers and decliners, new highs and lows, Treasury-duration behavior, the volatility complex, Cboe put/call ratios, Federal Reserve liquidity conditions, credit spreads, credit ETFs, and broad global transmission.
Flow evidence was usable only with its reporting convention preserved. Weekly fund flows, ETF creation-and-redemption observations, sector allocation, bond demand, and international allocation were therefore kept separate rather than blended into a synthetic total.
Dealer gamma remained provisional because dealer inventories are modeled rather than directly observed. Available evidence suggested a less favorable stabilization cushion, but no matched final end-of-day dealer-positioning observation was available.
Evidence Rule: Observations determine state. Correlated signals are consolidated. Missing evidence is never replaced by price inference.
Executive Summary
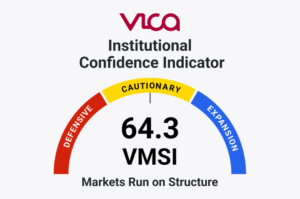
The VMSI™ Composite increased to 64.7 from 64.3 as participation broadened and surface volatility declined. Momentum rose to 70.8, SPI reached 70.3, and global propagation strengthened.
IWM gained 1.17%, while RSP advanced approximately 1.22% against 0.36% for the S&P 500. Value outperformed growth, and the percentage of S&P 500 constituents above their 50-day moving average increased 3.78 percentage points to 69.38%.
The improvement was not matched by the underlying liquidity structure. Average reserve balances declined approximately $49.3 billion, the Treasury General Account increased approximately $56.6 billion, long-duration Treasuries weakened, and weekly-average equity and index put/call ratios increased despite lower headline volatility.
Participation strengthened while reserve liquidity contracted and protection demand remained unresolved.
Market Structure
Domestic participation broadened despite modest headline-index performance. The S&P 500 gained 0.36%, the Nasdaq Composite increased 0.14%, the Dow declined 0.56%, and IWM advanced 1.17%.
Approximately 66.20% of S&P 500 constituents finished above their 20-day moving averages, 69.38% above their 50-day averages, and 72.76% above their 200-day averages. NYSE advancers exceeded decliners 1,034 to 806, while new highs exceeded new lows 58 to 11.
Leadership became less concentrated. RSP outperformed the S&P 500, and VTV gained 1.43% while VUG declined 0.07%. The limitation was long-horizon breadth: the 200-day measure did not improve, so the system added participation without materially increasing structural redundancy.
Participation broadened faster than directional synchronization strengthened.
Credit & Liquidity Conditions
Credit remained orderly while liquidity and Treasury duration deteriorated. The separation between these channels is central to the week’s structural signal.
Latest matched high-yield OAS was 271 basis points, only one basis point wider than August 7, while investment-grade OAS was 79 basis points, also one basis point wider. HYG and SJNK remained firm, even as duration-sensitive LQD weakened.
Federal Reserve total assets increased approximately $11.4 billion, but average reserve balances declined $49.3 billion and the average Treasury General Account increased $56.6 billion. ON RRP ended near $250 million, leaving little remaining buffer against Treasury cash absorption. Long-duration Treasury ETFs weakened as the long end of the curve repriced higher.
Long-duration confidence deteriorated faster than corporate credit confidence.
Positioning & Convexity
Surface volatility compressed across equity and rates markets, improving immediate stability. The compression was broad enough to constitute a system-level change rather than a single-index event.
VIX declined to 14.25, VVIX to 87.48, VXN to 20.72, and MOVE to 69.58. VXN fell approximately 9.2%, VIX declined 4.36%, and MOVE fell 3.40%.
Protection architecture moved differently. SKEW increased 4.37% to 138.36, while five-day CPCE and CPCI averages rose to approximately 0.592 and 0.970, respectively. Available dealer-gamma estimates also indicated less distance between spot and the modeled stabilization threshold, although final dealer positioning could not be directly observed.
Surface volatility compressed faster than protection demand normalized.
Flow & Allocation Behavior
Capital deployment broadened selectively rather than becoming uniformly expansionary. The week’s flow record showed migration between exposures rather than undifferentiated risk accumulation.
Matched U.S. fund data showed approximately $2.58 billion of equity inflows and $9.4 billion of bond inflows. Dedicated technology funds, however, recorded approximately $4.62 billion of withdrawals, while separate ETF evidence favored bonds, value, international markets, and selected defensive exposures.
The distinction is important. Capital was still being deployed, but its destination changed. Complete matched creation-and-redemption totals for the full IC-VMSI™ basket remained unavailable, so price appreciation was not substituted for institutional buying evidence.
Capital deployment broadened while dedicated technology sponsorship weakened.
Structural Participation Integrity
SPI increased to 70.3 from 68.2 as breadth, smaller-cap leadership, and equal-weight performance improved together. This was the clearest structural improvement of the week.
The percentage of S&P 500 constituents above the 50-day moving average increased from 65.60% to 69.38%, while the 20-day measure rose to 66.20%. IWM outperformed the major large-cap indexes, RSP outperformed SPX, and new highs materially exceeded new lows.
The repair remained incomplete at the deepest horizon. The 200-day breadth measure held near 72.76% rather than improving further. The market therefore gained medium-term participation without a corresponding expansion in long-duration redundancy.
Participation improved faster than long-duration redundancy rebuilt.
Global Propagation Conditions
Global propagation strengthened despite a modestly firmer dollar. That makes the international participation signal more informative than one produced solely by currency relief.
EEM gained approximately 1.48%, IEMG 1.50%, EWJ 1.35%, VEA 0.95%, VXUS 0.56%, and ACWI 0.53%. Cash DXY increased modestly from approximately 99.54 to 99.67.
Regional synchronization remained incomplete. FXI declined approximately 3.54% and VWO fell 0.60%, leaving China and portions of emerging markets outside the improving transmission structure. WTI rose approximately 5.4%, while gold gained 0.76%, adding independent energy and defensive-asset counter-signals.
Global propagation broadened despite a firmer dollar, but China remained outside the synchronization process.
Advanced Signal Layer
The Advanced Framework strengthened selectively rather than uniformly. SPI rose to 70.3, CMX to 62.0, PDCS to 69.8, and GFP to 69.0, while IC-VMSI™ remained unchanged at 67.2.
The new information came primarily from participation and propagation. Medium-term breadth broadened, equal weight and small caps strengthened, value outperformed growth, and international equities advanced despite mild dollar pressure.
The constraints remained observable and independent: reserve liquidity contracted, technology sponsorship weakened, protection demand stayed elevated, and dealer stabilization became less certain. Matched core ETF creation-and-redemption evidence remained insufficient to justify an IC-VMSI™ upgrade.
Institutional force vectors broadened faster than direct accumulation confirmation strengthened.
CMX — Convexity Metrics Index
CMX increased to 62.0 from 61.2 as equity, volatility-of-volatility, Nasdaq, and rates volatility compressed together.
Lower VIX, VVIX, VXN, and MOVE reduced immediate convexity pressure across multiple markets. The improvement was therefore broader than a single volatility measure.
Tail and positioning evidence prevented a stronger upgrade. SKEW rose, weekly-average CPCE and CPCI increased, and the modeled dealer stabilization cushion narrowed. Surface calm was therefore not equivalent to complete protection normalization.
Convexity compression improved without eliminating protection asymmetry.
PDCS — Pre-Deployment Capital Signals
PDCS increased to 69.8 from 68.8 as more channels became available for institutional capital deployment.
Positive broad equity-fund flows, substantial bond demand, international participation, stable credit, and lower surface volatility all reduced deployment friction. Value and smaller-cap participation also broadened.
The structure remained selective. Technology withdrawals were material, reserve liquidity deteriorated, and matched full-basket creation-and-redemption evidence remained incomplete. The system improved its capacity to accept capital faster than it demonstrated broad accumulation.
Deployment broadened without restoring full accumulation redundancy.
GFP — Global Propagation Framework
GFP increased to 69.0 from 67.2 as international transmission became more coherent across multiple regions.
Developed markets, Japan, broad international equities, and portions of emerging markets strengthened simultaneously. The advance persisted despite modest dollar appreciation.
China remained the principal fracture, while VWO failed to confirm the strength visible in several other emerging-market structures. The system moved closer to synchronization without achieving uniform propagation.
Global synchronization strengthened while regional asymmetry persisted.
PLMT — Post-Linear Market Structure
The PLMT regime remains Selective Synchronization Expansion. The regime did not change, but the location of strength within the system did.
Participation, equal-weight leadership, global propagation, and surface-volatility conditions improved. Credit remained stable and did not validate the deterioration visible in Treasury duration.
Reserve liquidity, long-duration confidence, technology sponsorship, and modeled dealer support weakened simultaneously. Those conditions prevent a transition to Broad Participation Expansion despite broader participation itself.
Synchronization expanded through participation while structural support became less uniform.
What information did the system gain this week?
Three Hidden-State Discoveries
1. Participation strengthened while reserve liquidity contracted.
Small caps, equal weight, value, and medium-term breadth improved while reserve balances declined and Treasury cash accumulation absorbed liquidity.
The participation expansion was not liquidity-driven.
2. Surface volatility compressed faster than protection demand normalized.
VIX, VXN, VVIX, and MOVE declined while SKEW and weekly-average CPCE/CPCI moved higher.
Calm became more visible than safety.
3. Duration deteriorated without transmitting into credit stress.
Long-duration Treasuries weakened and the curve steepened while HY and IG spreads remained essentially stable.
The system distinguished duration rejection from corporate-credit deterioration.
What did VMSI™ discover this week that price alone did not reveal?
The market broadened while the infrastructure supporting that breadth became less uniform.
Earnings Topline
Earnings remained resilient; capital rewarded cleaner beats over mixed results.
Institutional Capital Migration Index™
Institutional Capital Migration Dashboard™
Component
Score
Weekly Change
Trend
Interpretation
ETF Capital Flows
49.0
+1.0
▲
Capital migrated selectively rather than accumulating broadly.
Dealer Positioning
53.0
−1.0
▼
Mechanical stabilization persisted with a narrower modeled cushion.
Credit remained stable despite duration deterioration.
Cross-Asset Confirmation
58.5
+1.5
▲
Cross-asset confirmation improved but remained incomplete.
Institutional Capital Migration Index™
54.8
−0.2
▼
Capital migration softened beneath broader participation.
Institutional Capital Forensics™
ICMI™ declined modestly to 54.8 from 55.0, even as VMSI™ increased. That divergence is informative: observable market participation improved without equivalent improvement in institutional capital-migration evidence.
Capital flows remained rotational. Bond demand was constructive, international allocation strengthened, and value participation improved, while dedicated technology sponsorship deteriorated. Full matched core-ETF creation-and-redemption data remained incomplete, preventing broad accumulation from being inferred.
Liquidity supplied the clearest negative footprint. Reserve balances contracted as Treasury cash increased, while dealer positioning appeared less mechanically supportive on a modeled basis. Credit again refused to confirm deterioration: HY and IG spreads remained effectively unchanged.
ICMI™ Confirmation: Market participation strengthened faster than institutional capital migration improved.
Final Institutional Assessment
Institutional market participation improved during the week ending August 14. The VMSI™ Composite increased to 64.7 as medium-term breadth strengthened, small caps and equal weight gained relative leadership, surface volatility compressed, and international transmission broadened.
The unresolved structure shifted beneath the advance. Reserve liquidity contracted, long-duration confidence weakened, protection demand remained elevated, technology sponsorship deteriorated, and modeled dealer stabilization became less certain. Credit remained the principal stabilizer because corporate spreads did not transmit the deterioration visible elsewhere.
Current Regime: Selective Synchronization Expansion. The system broadened through participation and global propagation, but liquidity, protection architecture, and direct capital-migration confirmation remain too uneven for Broad Participation Expansion. VMSI™ improved while ICMI™ softened slightly, revealing a market whose observable participation strengthened faster than its institutional capital-migration evidence.
Participation Broadened. Liquidity Contracted.
About VMSI™
The VICA Institutional Market Sentiment Index (VMSI™) is an observational market framework designed to measure the institutional conditions shaping market behavior before those conditions become fully reflected in price.
Rather than interpreting indicators independently, VMSI™ measures relationships among participation, liquidity, credit, positioning, capital deployment, and global propagation to identify changes in underlying market organization.
Each weekly publication integrates observable market data, proprietary relationship metrics, and independent structural validation to identify the prevailing institutional market regime.
IC-VMSI™ measures the daily force of institutional core buying across passive and benchmark-linked fund structures, led by Vanguard and BlackRock fund-flow behavior.
The framework estimates institutional capital deployment using observable allocation, creation-and-redemption activity, ownership structures, portfolio positioning, and benchmark-linked investment behavior rather than attempting to identify individual institutional trades.
Disclaimer
VMSI™ is a proprietary observational market framework developed by VICA Research. This publication is provided for informational purposes only and does not constitute investment advice or a recommendation to buy or sell any security.
Conclusions reflect evidence-based interpretations of available market information at the time of publication and may change as new evidence becomes available.
Trademark Notice
VMSI™, IC-VMSI™, ICMI™, Institutional Capital Migration Index™, Institutional Capital Forensics™, and associated framework names are trademarks of VICA Research.
Opening Summary Institutional market conditions improved marginally as large-cap and global equities recovered and equity-volatility pressure declined. The VMSI™ Composite...
Opening Summary Institutional market conditions weakened as reserve liquidity contracted, US equity momentum softened, and Treasury-duration pressure increased. The VMSI™...