Capital Is Being Absorbed Without Triggering a Regime Shift
May 1, 2026
Matthew Krumholz
VMSI Report, May 1, 2026
Earnings concentrated, indices driven
Capital is entering both sides of the market without commitment.
VMSI Snapshot
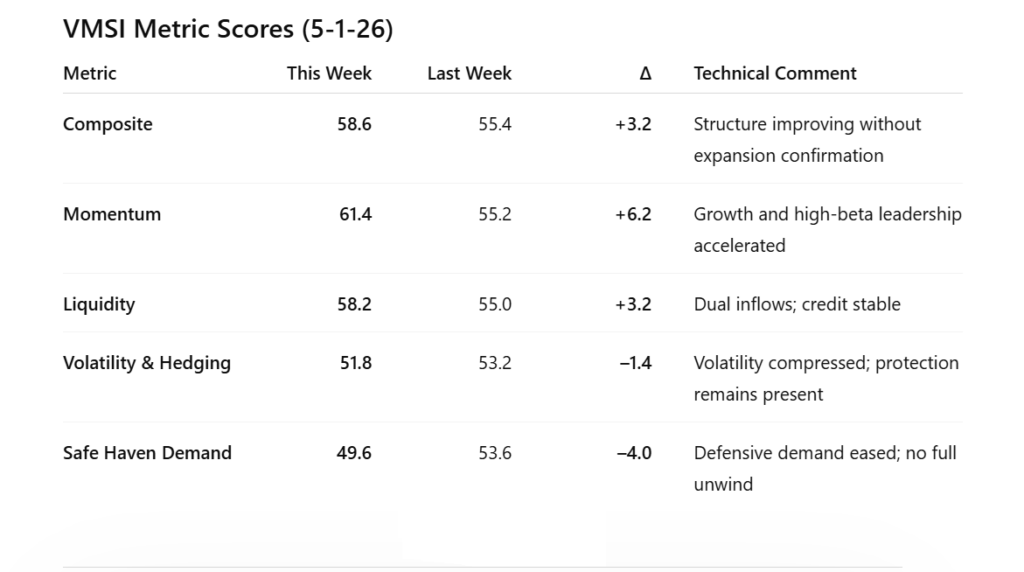
The VICA Institutional Market Sentiment Index (VMSI) increased to 58.6 (+3.2 WoW), moving deeper into the Neutral range as momentum strengthened and volatility compressed. Momentum rose to 61.4, liquidity improved to 58.2, while volatility & hedging declined to 51.8 and safe haven demand eased to 49.6. Conditions are improving. Deployment is not.
VMSI Metrics
Executive Summary
Equities advanced, led by index concentration. The S&P 500 closed at 7,230.12 (+9.96% 1M) and the Nasdaq at 25,114.44 (+14.99% 1M). Volatility compressed, with VIX at 16.99 (–28% vs 20D).
Credit did not confirm. High Yield OAS remains near 285 bps (+2 bps WoW) and Investment Grade near 80 bps (flat). Flows were dual-sided, with approximately +$24B into equities and +$14B into bonds. Allocation is increasing. Commitment is not.
Market Structure
Price is leading participation. The S&P 500 is approximately +14.8% above its 200-day moving average, while equal-weight performance (RSP) lags and does not confirm.
Breadth remains incomplete, with approximately ~53% above 50-day and approximately ~60% above 200-day. Momentum is extended, with stochastic readings above 90% across 20–50 day windows and RSI sustained above 70, indicating overbought conditions without participation expansion.
Earnings reinforced index strength but remained concentrated. Transmission across the broader market is limited.
Credit & Liquidity Conditions
Credit remains stable and non-confirmatory. High Yield OAS holds near 285 bps (+2 bps WoW). Investment Grade OAS remains near 80 bps (flat). No tightening is evident.
ETF pricing confirms the same condition. HYG (~80.06) and LQD (~108.60) remain below key trend levels without breakout. Liquidity remains unchanged, with the Federal Reserve balance sheet near $6.70 trillion. No expansion impulse is present.
Flow & Allocation Behavior
Flow composition defines the regime. Equity ETF inflows totaled approximately +$24B, while bond ETF inflows reached approximately +$14B. Capital is allocating to both risk and protection simultaneously.
Sector dispersion reinforces the signal. Growth (VUG) is +13.8% over 20 days, while value (VTV) is +4.5%, confirming selective exposure rather than broad rotation.
Exposure is increasing. Risk is not being fully transferred.
Positioning & Hedging
Volatility declined, but hedging persists. VIX closed at 16.99, VVIX remains near 95, and VXN near 21.9. SKEW remains elevated at 143.
Volatility structure confirms underlying protection demand. VVIX remains elevated despite declining spot volatility. CPCE declined to 0.46, while CPCI remains elevated. Hedging has been reduced, not removed.
Advanced Signal Layer
System signals are stable but do not confirm each other. Credit spreads remain unchanged (~285 bps HY), and investment grade remains flat across timeframes.
Rates confirm the same divergence. Long-duration (TLT ~85.6) remains below trend, while short-duration (SHY ~82.25) remains stable. No duration-driven expansion is occurring. Fed liquidity remains static near $6.70 trillion.
The defining pattern is non-confirmation. Equities are advancing while credit, rates, and liquidity remain inert. This reflects absorption, not expansion. Price is moving ahead of capital commitment, not being driven by it.
CMX — Convexity Metrics Index
CMX remains contained, with a current reading of 46.5 / 100 within the contained range. VIX at 16.99 (–28% vs 20D) and VVIX near 95 (–17% vs 20D) indicate reduced convexity demand, while SKEW at 143 confirms persistent tail-risk hedging.
Cross-asset convexity remains muted. The MOVE Index at 72 shows no acceleration alongside equity volatility compression. Credit (~285 bps HY) shows no tightening.
Market movement is not triggering forced positioning or convexity feedback loops. Positioning sensitivity remains low.
The environment reflects a low-convexity regime where directional moves are less likely to cascade. Risk can be accumulated without triggering mechanical dislocation. This favors controlled exposure increases, carry strategies, and relative value positioning over convexity-dependent trades.
Pre-Deployment Capital Signals (PDCS)
PDCS reads 68 / 100, reflecting pre-deployment positioning. Equity inflows (~+$24B) are matched by bond inflows (~+$14B). Credit remains stable (~285 bps HY), breadth remains incomplete (~53% above 50-day), and convexity remains contained (CMX 46.5).
Credit is not tightening. Defensive demand persists. Capital is staging.
At this stage of the cycle, capital is positioning ahead of a potential regime shift without committing directionally. This favors staged entry, incremental exposure building, and optionality preservation rather than full deployment.
VMSI Index Insight
Markets are advancing ahead of confirmation. Momentum (61.4) and volatility compression (VIX 16.99) are improving, but credit (~285 bps HY), dual flows, elevated SKEW (143), and contained convexity do not confirm expansion.
What the VMSI framework isolates—and what most miss—is that this is not a momentum-driven expansion. It is a capital absorption phase. Price is rising without confirmation from credit, liquidity, or positioning sensitivity. Capital is entering the system without triggering a structural regime shift.
What Most Are Missing
The rally is being interpreted as confirmation. It is not. Credit is unchanged. Flows are dual-sided. Hedging remains. Participation is incomplete. Convexity is contained.
Bottom Line
The VMSI at 58.6 reflects improving surface conditions driven by momentum and declining volatility. Credit (~285 bps HY), dual inflows (~+$24B equities / +$14B bonds), elevated SKEW (143), and CMX containment (46.5) confirm that deployment has not occurred.
This is not broad risk-on.
This is a pre-deployment regime defined by dual inflows without convexity expansion.
VICA Research
View the live VMSI Index and historical readings on the VICA platform.
About the VICA Institutional Market Sentiment Index (VMSI)
The VICA Institutional Market Sentiment Index (VMSI) is a proprietary model that measures institutional risk posture across global markets.
It combines cross-asset inputs including momentum, liquidity, volatility structure, credit conditions, and safe-haven demand.
Scores are generated through a systematic model using volatility regimes, credit spreads, liquidity conditions, macro signals, and positioning data.
This report is for informational purposes only and does not constitute investment advice or a recommendation. Views are based on current data and VICA Research models and are subject to change. No guarantee is made as to accuracy or completeness. Past performance is not indicative of future results.
Important Notice
This report and the proprietary VICA Market Sentiment Index (VMSI) are protected intellectual property. Unauthorized use is strictly prohibited.
VICA Research
Capital does not follow headlines. It follows structure.
Short- and intermediate-horizon participation weakened as volatility and convexity pressure increased. Observable capital deployment strengthened, Treasury cash pressure eased, and...
VICA Partners Research Institutional participation broadened as small caps, equal weight, medium-term breadth, and global equity transmission strengthened while surface...