This Is Not Broad Risk-On. It Is Barbelled Pre-Deployment.
April 25, 2026
Matthew Krumholz
VMSI Report, April 24, 2026
Capital is adding growth exposure while retaining protection.
The VMSI increased to 55.4 (+2.1 WoW) as momentum accelerated and volatility compressed. However, equal-weight confirmation, credit acceleration, flow composition, and hedging behavior do not confirm broad institutional deployment.
VMSI Snapshot
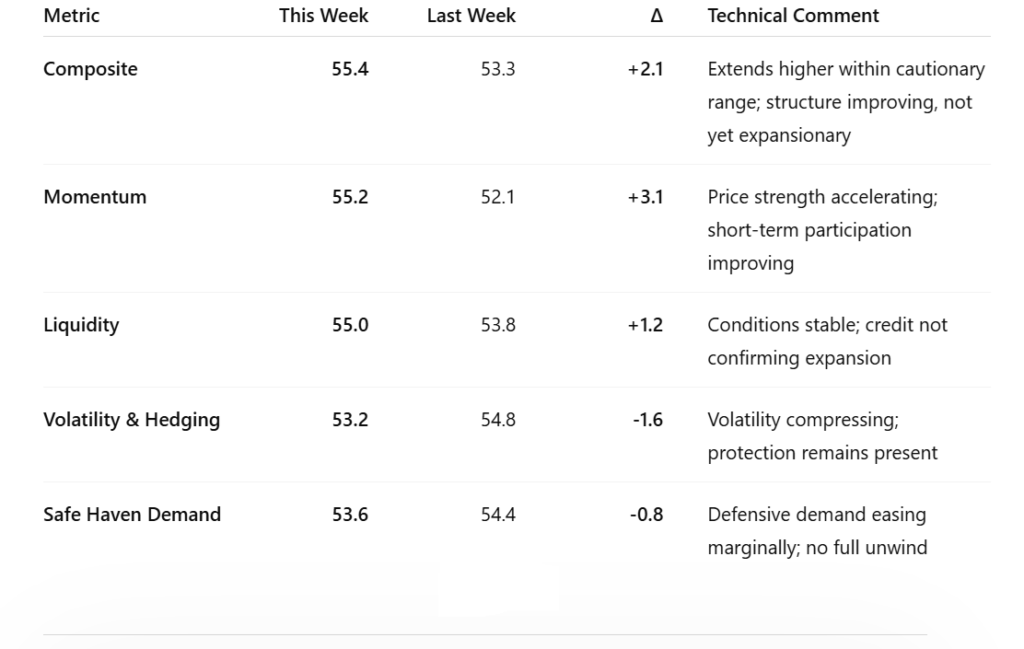
The VMSI increased to 55.4 (+2.1 WoW), extending higher within the Cautionary Optimism range.
Momentum rose to 55.2, liquidity improved to 55.0, while volatility & hedging declined to 53.2 and safe haven demand eased to 53.6.
The system is strengthening. Institutional confirmation is not.
VMSI Breakdown
Executive Summary
Momentum accelerated across major indices, with technology leadership driving the S&P 500 and Nasdaq to new highs while the Dow lagged and equal-weight participation failed to confirm the same strength. The S&P 500 closed at 7,165.08, the Nasdaq at 24,836.60, the Dow at 49,230.71, and the Russell 2000 at 2,787.00.
Yet the forward signal remains more nuanced than the headline index move.
Credit is stable, but not accelerating. Volatility is declining, but tail-risk pricing remains present. Flows are strong, but concentrated in growth, quality, and protection — not broad rotation.
This combination does not reflect full capital deployment. It reflects barbelled pre-deployment.
The market is moving ahead of confirmation. Institutions are adding exposure while retaining protection.
Market Structure
The divergence between price and participation remains the key structural feature of this tape.
Cap-weighted leadership is driving the index move, while equal-weight confirmation remains incomplete. The S&P 500 and Nasdaq advanced to record levels, but the Invesco S&P 500 Equal Weight ETF declined on the day and also appeared among major ETF redemptions in the latest weekly flow data.
VICA breadth work confirms the same structure. Short-term participation improved, but intermediate confirmation remains incomplete, with only roughly half of constituents confirming the 50-day trend.
This is the critical distinction:
The advance is real. The confirmation is not broad.
Cap-weighted performance is leading. Equal-weight participation is lagging.
Credit & Liquidity Conditions
Credit markets remain stable, but they do not confirm expansion.
High Yield OAS held near 2.86% through the latest available reading, effectively unchanged versus the prior report level. The latest daily observations show High Yield OAS moving between 2.83% and 2.87% during the week, ending at 2.86%.
Investment Grade OAS remained near 0.80%, with latest observations holding in a narrow 0.79%–0.81% range.
This matters because credit is not flashing stress, but it is also not validating a broad risk-on transition.
Credit is stabilizing, not accelerating.
Liquidity conditions remain stable. The Federal Reserve balance sheet stood near $6.707 trillion in the latest weekly reading, with no material expansion impulse visible.
Flow & Allocation Behavior
Flow data provides the clearest institutional signal.
Latest available ETF flow data showed $39.6B of total U.S.-listed ETF inflows for the week ending April 17. U.S. equity ETFs attracted $23.5B, international equity ETFs attracted $13.7B, and the largest individual inflow went to QQQ at roughly $6.5B.
But the composition is more important than the total.
Growth exposure attracted capital. QQQ and VUG both appeared among the largest creations. At the same time, GLD attracted about $1.8B, LQD attracted about $1.3B, while RSP, IWD, and DIA appeared among notable redemptions.
This is not broad rotation.
It is a barbell.
Capital is adding growth exposure while retaining quality and protection.
Positioning & Hedging
Volatility declined across the system, but hedging has not fully cleared.
The VIX closed at 18.71, down 3.11%, confirming surface-level volatility compression. At the same time, SKEW remained near 139, indicating tail-risk pricing is still present beneath the decline in headline volatility.
The signal is not panic. It is not complacency either.
Protection has been reduced. It has not been removed.
This remains consistent with institutions preparing exposure while keeping downside protection in place.
Advanced Signal Layer
Dealer positioning remains consistent with a volatility-suppression regime, supporting controlled upside and mean-reverting market behavior. That helps explain why volatility can compress while equity indices rise.
Credit spread acceleration does not confirm a full transition. High Yield OAS is effectively flat versus the prior report level, while Investment Grade OAS remains stable. The weekly signal is stabilization, not acceleration.
Liquidity is also not forcing the move. With the Fed balance sheet broadly stable, the current advance is not being driven by a fresh liquidity impulse.
The advanced signal layer confirms the same conclusion:
Market stability is being supported by structure, not broad capital deployment.
Pre-Deployment Capital Signals (PDCS)
(Institutional Positioning Layer)
Institutional capital is positioned ahead of observable market movement, not in reaction to it.
Current PDCS readings indicate a barbelled pre-deployment environment, where exposure is increasing, but portfolios are not being reallocated at scale.
Flow behavior confirms this precisely.
The key signal is not equity inflow alone. It is the coexistence of growth inflows, defensive demand, and equal-weight weakness.
If capital were deploying broadly, the signal would be clear: equal-weight participation would confirm, value would participate more decisively, credit spreads would accelerate tighter, and defensive assets would experience sustained outflows.
That is not occurring.
Instead, capital is adding growth exposure while retaining protection.
Positioning reflects preparation, not commitment.
VMSI Index Insight
Markets are advancing faster than capital is fully deploying.
Momentum, volatility compression, and short-term participation confirm improving conditions. However, breadth, credit acceleration, flow composition, and hedging behavior do not confirm a transition into a broad expansionary regime.
This is not full risk-on.
It is a staged positioning phase where institutions are aligning ahead of confirmation, adding exposure selectively while maintaining protection.
What Most Are Missing
The current rally is being interpreted as confirmation.
The data suggests otherwise.
Credit is stable, but not accelerating. Flows are strong, but concentrated. Hedging remains structurally present. Equal-weight participation is lagging. Defensive demand has not fully unwound.
This is not broad commitment.
It is barbelled pre-deployment beneath a rising market.
Bottom Line
The VMSI at 55.4 confirms improving market structure, driven by momentum expansion and declining volatility.
However, the system does not yet reflect full institutional deployment.
Markets are advancing. Capital is aligning. Commitment has not followed.
The correct read is not broad risk-on.
Capital is adding growth exposure while retaining protection.
Access the Full Institutional Report
Access the live VMSI Index, full report archive, and institutional insights at VICA Partners
VICA Partners Research
About the VICA Institutional Market Sentiment Index (VMSI)
The VMSI is VICA Research’s proprietary sentiment gauge designed to track shifts in institutional risk behavior, capital flow posture, and macro-driven volatility signals.
Index Scale
0–25: Critical Risk Zone 26–49: Defensive 50–74: Cautionary Optimism 75–100: Expansion / High Confidence
Important Notice
This report and the proprietary VICA Market Sentiment Index (VMSI) are protected intellectual property. Unauthorized use is prohibited.
VICA Research Capital does not follow headlines. It follows structure.
Short- and intermediate-horizon participation weakened as volatility and convexity pressure increased. Observable capital deployment strengthened, Treasury cash pressure eased, and...
VICA Partners Research Institutional participation broadened as small caps, equal weight, medium-term breadth, and global equity transmission strengthened while surface...