Capital returned. Trust lagged. The system improved less than markets.
June 15, 2026
Matthew Krumholz
Participation broadened across domestic and global markets as institutional deployment improved and volatility conditions stabilized. Resilience remained incomplete as leadership concentration, liquidity dependency, and selective participation continued to drive the system.
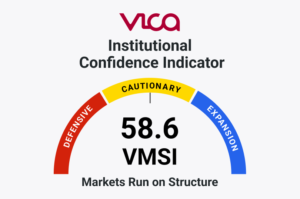
The VICA Institutional Market Sentiment Index (VMSI) increased to 61.0 from 58.6 last week as participation broadened, volatility conditions stabilized, and global propagation improved.
The Russell 2000 led major U.S. benchmarks, S&P 500 breadth improved, value outperformed growth, and volatility compressed across key measures. VIX closed at 17.68, VVIX at 93.82, VXN at 27.27, SKEW at 142.60, MOVE at 69.36, CPCE at 0.54, and CPCI at 1.06. Credit spreads remained contained, with HY OAS near 278 bps and IG OAS near 75 bps, while Fed liquidity remained functional with Fed assets near $6.725T, Reverse Repo near $1B, and the Treasury General Account near $828B.
The key hidden-state transition was not that markets advanced. The deeper transition was that more areas of the system participated while resilience remained dependent on selective leadership, liquidity support, and incomplete synchronization.
Participation improved faster than resilience rebuilt.
Market Structure
Market structure improved as participation broadened beyond the narrow leadership conditions that dominated recent months.
The S&P 500 closed at 7,431.46, the Nasdaq Composite at 25,888.84, the Dow Jones Industrial Average at 51,202.26, and the Russell 2000 at 2,943.99. The Russell 2000 materially outperformed for the week, while the S&P 500, Nasdaq, Dow, and Russell 2000 remained above key intermediate and long-term trend measures. Equal-weight participation improved, value leadership strengthened, and breadth expanded beneath the headline index move.
However, concentration dependency was not eliminated. The improvement was broader than last week, but market strength still relied on a limited set of leadership and liquidity-sensitive transmission channels.
Participation improved faster than concentration declined.
Credit & Liquidity Conditions
Credit and liquidity conditions remained supportive of institutional risk participation.
HY OAS held near 278 bps, compared with roughly 276 bps the prior week, while IG OAS held near 75 bps, compared with roughly 74 bps the prior week. HYG closed at 79.94, LQD at 109.01, SJNK at 25.00, and EMB at 96.36. Credit ETFs remained stable, emerging-market credit strengthened, and liquidity conditions remained functional with Fed assets near $6.725T, Reverse Repo near $1B, and the Treasury General Account near $828B.
The hidden signal was that credit markets continued to validate participation rather than challenge it. Spreads were flat to slightly wider week-over-week, but credit behavior did not confirm systemic stress or institutional withdrawal.
Liquidity improved faster than confidence.
Positioning & Convexity
Positioning conditions improved as volatility compressed and protection demand moderated.
VIX declined to 17.68, VVIX declined to 93.82, VXN declined to 27.27, and MOVE declined to 69.36. SKEW remained elevated at 142.60, while CPCE closed at 0.54 and CPCI closed at 1.06, indicating that hedging demand eased but did not disappear.
The hidden pattern was not a full reset in positioning. Investors reduced urgency around downside protection, but options and volatility structures still reflected residual caution beneath the improved tape.
Volatility eased faster than protection demand normalized.
Flow & Allocation Behavior
Institutional deployment broadened during the week.
Value-oriented participation strengthened materially, with VTV and IWD outperforming growth-oriented vehicles such as VUG and IWF. Equal-weight participation improved, small caps led major U.S. benchmarks, and credit-sensitive allocation vehicles remained stable. International allocation channels also strengthened, with VXUS, VEA, VWO, IEMG, and EFA participating constructively.
The hidden signal was not indiscriminate risk-taking. Capital moved beyond the most concentrated leadership groups, but the allocation pattern remained selective rather than fully broad-based.
Deployment broadened without restoring redundancy quality.
Structural Participation Integrity (SPI)
Structural Participation Integrity improved to 62.5 as participation broadened beneath headline index performance.
S&P 500 breadth improved, with 305 advancers versus 196 decliners, roughly 61% of S&P 500 constituents above the 50-day moving average, and roughly 61% above the 200-day moving average. Broad-market short-term breadth also improved, while new highs exceeded new lows.
However, participation integrity remained incomplete. Breadth improved, but the system did not yet display enough independent participation layers to confirm full redundancy.
Participation improved faster than resilience rebuilt.
Global Propagation Conditions
Global propagation improved during the week.
EEM, EWJ, VXUS, VEA, VWO, IEMG, and EFA strengthened, while the dollar remained relatively contained. DXY held near 99.81, WTI crude settled near $84.88, and VNQ closed near 98.51. China remained the weakest major propagation channel, but it no longer dominated the global participation structure.
The hidden signal was that external participation improved without achieving full synchronization. Global risk appetite strengthened, but propagation remained uneven across regions and asset channels.
Global propagation improved faster than synchronization completed.
Advanced Signal Layer
The advanced signal layer confirmed improving institutional conditions beneath the surface.
Credit spreads remained contained, participation broadened, volatility compressed, and benchmark-linked institutional deployment improved. SPI, PDCS, GFP, and IC-VMSI all reflected stronger system participation than the prior week, while CMX remained constrained by incomplete convexity normalization.
However, several structural dependencies remained unresolved. Concentration, liquidity reliance, residual hedging demand, and incomplete dealer-positioning confirmation continued to limit resilience quality.
Synchronization improved faster than redundancy rebuilt.
IC-VMSI — Institutional Core Buying
IC-VMSI registered 67.2, indicating stronger institutional core buying across passive and benchmark-linked allocation structures.
Core funds including VOO, VTI, IVV, ITOT, VXUS, ACWI, VEA, VWO, IEMG, and EFA continued to display constructive participation characteristics. Value-oriented vehicles such as VTV and IWD strengthened further, while growth-oriented participation remained more selective. Credit-sensitive allocations including BND, AGG, LQD, and HYG remained stable.
The hidden signal was that large institutional allocators continued deploying capital while maintaining selective risk preferences. IC-VMSI revealed that core institutional buying strengthened, but conviction did not broaden uniformly across growth, credit, duration, and global allocation channels.
Core buying expanded faster than conviction broadened.
CMX — Convexity Metrics Index
CMX increased to 58.2 as convexity conditions improved.
Volatility compressed across VIX, VVIX, VXN, and MOVE, while equity and index put/call ratios moderated from elevated protection conditions. SKEW remained above 140, confirming that tail-risk pricing did not fully normalize.
The hidden signal was that convexity stress eased without clearing. Protection demand declined, but the system remained sensitive to incomplete volatility normalization and residual hedging structures.
Convexity pressure eased. Compression remained.
PDCS — Pre-Deployment Capital Signals
PDCS increased to 69.4 as institutional deployment broadened.
Core allocation vehicles, value participation, equal-weight participation, small caps, international equities, and credit-sensitive instruments improved simultaneously. Credit ETFs remained orderly, and deployment signals broadened beyond mega-cap growth leadership.
The hidden signal was that capital was being deployed, but not indiscriminately. Institutions expanded exposure while maintaining selectivity across growth, credit, global, and duration channels.
Capital broadened without becoming indiscriminate.
GFP — Global Propagation Framework
GFP increased to 64.8 as global participation improved.
Emerging markets, developed international equities, Japan, and broad international allocation vehicles strengthened, while dollar conditions remained relatively contained. China remained weaker than other external channels, but global participation no longer reflected broad propagation failure.
The hidden signal was that external participation stabilized without becoming fully synchronized. Global transmission improved, but regional dispersion remained embedded.
Global propagation improved without achieving full synchronization.
Post-Linear Market Theory (PLMT)
The dominant system transition this week was expanding participation beneath incomplete resilience.
Institutional systems strengthened across breadth, deployment, propagation, volatility, and core allocation channels simultaneously. However, resilience remained dependent on selective leadership, liquidity support, residual hedging, and incomplete redundancy.
The hidden-state relationship was that visible market strength and structural resilience remained separate conditions. Price improved, but the system did not fully transition into broad, self-reinforcing expansion.
Visible strength and structural resilience remain different states.
Participation improved while resilience remained incomplete.
Final Institutional Assessment
Institutional conditions improved this week. Participation broadened, volatility stabilized, global propagation strengthened, and institutional deployment expanded.
However, resilience remains incomplete. Concentration dependency, liquidity reliance, residual hedging demand, and selective institutional conviction continue to limit the quality of expansion beneath headline market strength.
Current Regime: Selective Synchronization Expansion
Participation Improved. Resilience Lagged.
About the VICA Institutional Market Sentiment Index (VMSI)
The VMSI is VICA Research’s proprietary sentiment gauge designed to track shifts in institutional risk behavior, capital flow posture, and macro-driven volatility signals.
Each weekly score reflects a multi-factor model that incorporates a blend of market structure, flow dynamics, defensive rotation, and volatility hedging — calibrated against key technical and behavioral thresholds.
Index Scale
0–25: Critical Risk Zone
26–49: Defensive
50–74: Cautionary Optimism
75–100: Expansion / High Confidence
Unlike retail-facing indicators, VMSI is engineered for tactical allocation and capital positioning — not emotion or media headlines. VICA publishes the index weekly to offer a forward-focused lens on institutional sentiment and market inflection dynamics.
IC-VMSI Definition
IC-VMSI (Institutional Core Buying Index) measures the force of institutional core buying across passive and benchmark-linked fund structures.
The framework estimates institutional accumulation pressure through ETF flows, allocation behavior, market-cap exposure, global deployment trends, and benchmark-linked capital movements.
Markets are analyzed in parts. VMSI measures the system.
Disclaimer
This report and the proprietary VICA Institutional Market Sentiment Index (VMSI) are confidential works of authorship protected by intellectual property laws. Unauthorized reproduction, copying, redistribution, or use without express permission from VICA Research is strictly prohibited and monitored.
This report is for informational purposes only and does not constitute investment advice or a recommendation. Views are based on current data and VICA Research models and are subject to change.
Credit conditions held while institutional protection demand expanded. Participation, duration confirmation, and global propagation remained incomplete beneath the hedging response....
Institutional synchronization improved this week as participation broadened, credit tightened, volatility compressed, and deployment expanded across multiple market structures. Redundancy...