Credit conditions held while institutional protection demand expanded. Participation, duration confirmation, and global propagation remained incomplete beneath the hedging response.
Live Report: vicapartners.com
VMSI Snapshot Table
Framework
Score
State
Comment
VMSI Composite
58.6
Fragile Stabilization
Shock absorbed; credit and breadth held.
Momentum
62.6
Breadth deteriorated beneath concentration.
Short-term momentum broke; trend remains intact.
Liquidity
60.3
Liquidity improved faster than confidence.
Spreads tight; Fed liquidity still constrained.
Volatility & Hedging
59.4
Hedging demand remained elevated.
Protection demand rose without credit stress.
Safe Haven Demand
55.1
Defensive positioning persisted.
Defensive demand rose without duration confirmation.
SPI
58.8
Participation integrity weakened but did not break.
Breadth mixed; participation remained relatively resilient.
Advanced Signal Layer Table
Framework
Score
State
Comment
CMX
56.6
Convexity compression remained incomplete.
Convexity stress re-expanded across protection layers.
PDCS
68.2
Deployment broadened selectively.
Deployment slowed, but flows stayed positive.
GFP
63.7
Global propagation remained uneven.
External propagation weakened under stronger dollar.
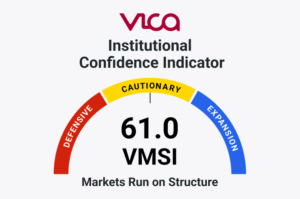
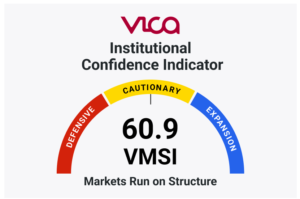
The VMSI declined to 58.6 from 60.9 last week as hedging demand increased, short-term momentum weakened, and external propagation deteriorated.
VIX closed at 21.51, VVIX at 102.04, VXN at 30.47, SKEW at 152.25, CPCE at 0.67, and CPCI at 1.13. HY OAS held near 2.74%, IG OAS held near 0.74%, equity ETF issuance remained positive at $14.29B, and bond ETF issuance remained positive at $15.24B.
The key hidden-state transition was not that markets declined. The deeper transition was that protection expanded across volatility and options structures while credit, flows, and participation failed to confirm full systemic deterioration.
Protection expanded faster than systemic stress developed.
Market Structure
Market structure weakened as short-term momentum broke and growth leadership deteriorated beneath intact longer-term trend conditions.
The S&P 500 closed at 7,383.74, the Nasdaq Composite at 25,709.43, the Dow Jones Industrial Average at 50,866.78, and the Russell 2000 at 2,833.50. The S&P 500 declined 2.62% over five days, the Nasdaq declined 4.61%, the Russell 2000 declined 2.26%, and the Dow declined 0.57%. The S&P 500 remained above its 50-day and 200-day moving averages, while the Nasdaq remained above its 50-day and 200-day moving averages despite the weekly decline.
However, concentration dependency remained embedded beneath the decline. Growth leadership weakened first, while longer-term trend structure and participation breadth remained more intact than headline price action implied.
Leadership weakened faster than participation deteriorated.
Credit & Liquidity Conditions
Credit and liquidity conditions remained the institutional core of this report.
HY OAS held near 2.74%, compared with 2.72% on 5/29 and 2.77% on 5/5. IG OAS held near 0.74%, compared with 0.73% on 5/29 and 0.79% on 5/5. HYG closed at 79.43 and LQD closed at 108.17. Fed assets stood near $6.711T, the Treasury General Account stood near $876B, and Reverse Repo stood near $6B.
However, credit spread acceleration did not confirm the volatility move. Spreads widened slightly week-over-week but remained tighter over the one-month window, while liquidity stayed functional but constrained by a large TGA and a nearly depleted RRP buffer.
Protection demand increased faster than credit stress developed.
Positioning & Convexity
Positioning shifted toward protection while systemic confirmation remained limited.
VIX closed at 21.51, VVIX at 102.04, VXN at 30.47, SKEW at 152.25, and MOVE at 75.20. CPCE increased to 0.67 and CPCI increased to 1.13, confirming higher equity and index protection demand.
However, the hidden pattern was not panic. Investors bought protection faster than credit, duration, or flow data confirmed systemic deterioration.
Investors bought protection faster than they reduced exposure.
Flow & Allocation Behavior
Institutional deployment slowed but did not reverse.
The latest ICI weekly ETF data showed equity ETF issuance of $14.29B and bond ETF issuance of $15.24B. Equity issuance declined from the prior week’s $16.15B, and bond issuance declined from $16.27B, but both remained positive. VTV held stronger than VUG, confirming a shift toward value participation.
The hidden signal was not capital withdrawal. The signal was hedging with continued allocation, as institutions increased protection while capital continued moving through the system.
Deployment slowed without abandoning participation.
Structural Participation Integrity (SPI)
Structural Participation Integrity weakened but did not break.
S&P 500 stocks above their 20-day moving average held near 59.64%. Stocks above their 50-day moving average held near 53.67%, and stocks above their 200-day moving average held near 58.05%. Breadth data were mixed, but the majority of constituents remained above key medium- and long-term trend thresholds.
However, participation integrity remained incomplete. The selloff damaged short-term momentum more than it damaged structural participation, but concentration dependency and incomplete redundancy remained embedded.
Participation weakened slower than protection demand increased.
Global Propagation Conditions
Global propagation weakened beneath a stronger dollar.
EEM declined 6.53%, EWJ declined 3.62%, and FXI remained below its 20-day, 50-day, 100-day, and 200-day moving averages. DXY strengthened to 100.12 and moved above its 20-day and 200-day moving averages.
The global signal was clear. External participation deteriorated faster than domestic credit or liquidity conditions, confirming that the problem was propagation quality, not domestic credit failure.
Global propagation weakened faster than domestic liquidity conditions deteriorated.
Advanced Signal Layer
The advanced signal layer confirmed that the week’s dominant transition was protection expansion beneath incomplete systemic confirmation.
Credit spread acceleration did not confirm a deterioration regime. ETF flows remained positive. Fed liquidity remained functional but constrained. Dealer GEX, Zero Gamma, and Vol Trigger were not independently verified, so dealer positioning was not used to override the credit, liquidity, flow, and options evidence.
The VMSI signal was not that markets declined. The signal was that institutional hedging moved ahead of confirmed stress.
The system hedged before systemic stress confirmed.
This remains a Fragile Stabilization regime.
CMX — Convexity Metrics Index
CMX moved to 56.6 as convexity stress re-expanded across protection layers.
VIX, VVIX, VXN, SKEW, CPCE, and CPCI all moved higher. MOVE rose but did not confirm a full duration-volatility shock.
However, elevated protection demand did not receive equal confirmation from credit markets. Convexity pressure increased, but systemic stress did not propagate at the same rate.
Convexity stress expanded while credit stress lagged.
PDCS — Pre-Deployment Capital Signals
PDCS declined to 68.2 but remained inside a selective deployment regime.
Equity ETF issuance remained positive at $14.29B, bond ETF issuance remained positive at $15.24B, and credit ETFs remained orderly. Value participation outperformed growth participation.
However, deployment confirmation remained incomplete. Capital became more selective, but the system did not transition into withdrawal.
Capital slowed without abandoning participation.
GFP — Geopolitical Friction Pressure
GFP moved to 63.7 as external propagation weakened.
Emerging markets weakened, Japan softened, China remained structurally weak, and dollar strength increased. Domestic credit and liquidity conditions remained more stable than global participation channels.
However, broader propagation quality remained uneven. External synchronization deteriorated while domestic systemic stress remained limited.
External synchronization weakened faster than domestic conditions deteriorated.
Post-Linear Market Theory (PLMT)
One of the framework’s core principles became clearer this week.
Institutional systems can hedge before systemic stress confirms. Volatility expanded, protection demand increased, and participation weakened, but credit spreads, ETF issuance, and structural breadth did not confirm full systemic deterioration.
However, the system remained dependent on incomplete duration confirmation, residual hedging demand, concentration dependency, and uneven external propagation. Those conditions show that visible weakness and structural deterioration are not the same state.
Protection increased while systemic confirmation remained incomplete.
Final Institutional Assessment
Institutional conditions weakened this week. Hedging demand increased, short-term momentum deteriorated, and external propagation softened.
However, structural deterioration remained unconfirmed. Credit spreads stayed tight, ETF issuance stayed positive, and participation breadth remained mixed rather than broken. Duration confirmation, global synchronization, and redundancy quality remained incomplete beneath the hedging response.
Current conditions are best classified as a Fragile Stabilization regime rather than a Structural Deterioration regime.
Protection Expanded. Stress Lagged.
About the VICA Institutional Market Sentiment Index (VMSI)
The VICA Institutional Market Sentiment Index (VMSI) measures institutional risk across global markets through momentum, liquidity, volatility, credit, safe-haven demand, convexity dynamics, capital flow inertia, and geopolitical friction.
The model incorporates proprietary frameworks including CMX, PDCS, and GFP to identify state transitions in institutional behavior before they are fully reflected in price.
VMSI models markets as adaptive institutional systems where directional movement emerges through the synchronization, propagation, and interaction of capital flows, liquidity conditions, participation structures, and convexity positioning.
Unlike traditional sentiment frameworks, VMSI is engineered to identify hidden-state structural changes beneath headline market participation, including liquidity diffusion deterioration, convexity persistence, concentration dependency, propagation instability, and incomplete synchronization conditions.
Markets are analyzed in parts. VMSI™ measures the system.
Disclaimer
This report and the proprietary VICA Market Sentiment Index (VMSI) are confidential works of authorship protected by intellectual property laws. Unauthorized reproduction, copying, redistribution, or use without express permission from VICA Research is strictly prohibited and monitored.
This report is for informational purposes only and does not constitute investment advice or a recommendation. Views are based on current data and VICA Research models and are subject to change.
Participation broadened across domestic and global markets as institutional deployment improved and volatility conditions stabilized. Resilience remained incomplete as leadership...
Institutional synchronization improved this week as participation broadened, credit tightened, volatility compressed, and deployment expanded across multiple market structures. Redundancy...